Fix NGINX Performance Issues with Watchlog Monitoring

Is your NGINX server experiencing slow response times, memory spikes, or unexplained 5xx errors? In this guide, you'll learn how to monitor and troubleshoot NGINX performance issues effectively using Watchlog's real-time observability tools.
Introduction: Why NGINX Monitoring Matters
NGINX is one of the most powerful and efficient web servers and reverse proxies on the internet today. It's widely used to power modern websites, APIs, microservices, and edge infrastructures.
But no matter how performant NGINX is by default, it still faces challenges:
- Sudden spikes in traffic
- Backend slowdowns or timeouts
- Poorly configured workers or caching
- Lack of visibility into what’s actually happening
All of these can degrade user experience and hurt uptime. Without real-time monitoring, you're left guessing.
Watchlog provides a lightweight, fast, and visual way to understand your NGINX behavior — in real time.
Step 1: Identify Common NGINX Performance Bottlenecks
Before jumping into tools, it's critical to understand what causes performance degradation in NGINX.
🔍 Key Bottlenecks You Should Monitor:
- High CPU usage – Often caused by high request volume, logging overhead, or inefficient static file delivery
- Slow response times – May stem from backend service latency or poor caching strategy
- 5xx server errors – Indicators of upstream failures or exhausted memory
- Memory spikes – Typically due to large concurrent connections or misconfigured workers
- Network saturation – Missing rate limiting or over-parallelized clients
With proper monitoring, these symptoms become opportunities for optimization rather than sources of downtime.
Step 2: Set Up Real-Time Monitoring for NGINX
Watchlog offers seamless NGINX integration across environments like Ubuntu, Windows, Docker, Kubernetes, and more.
Follow our official integration guide to get started:
This guide will walk you through:
- Installing the Watchlog Agent
- Enabling NGINX metrics and access logs
- Connecting your server to the Watchlog dashboard
Once configured, your NGINX instance will begin sending metrics and logs in real time.
Step 3: Explore Metrics in the NGINX Dashboard
Access your real-time dashboard at:
👉 Watchlog NGINX Integration Panel
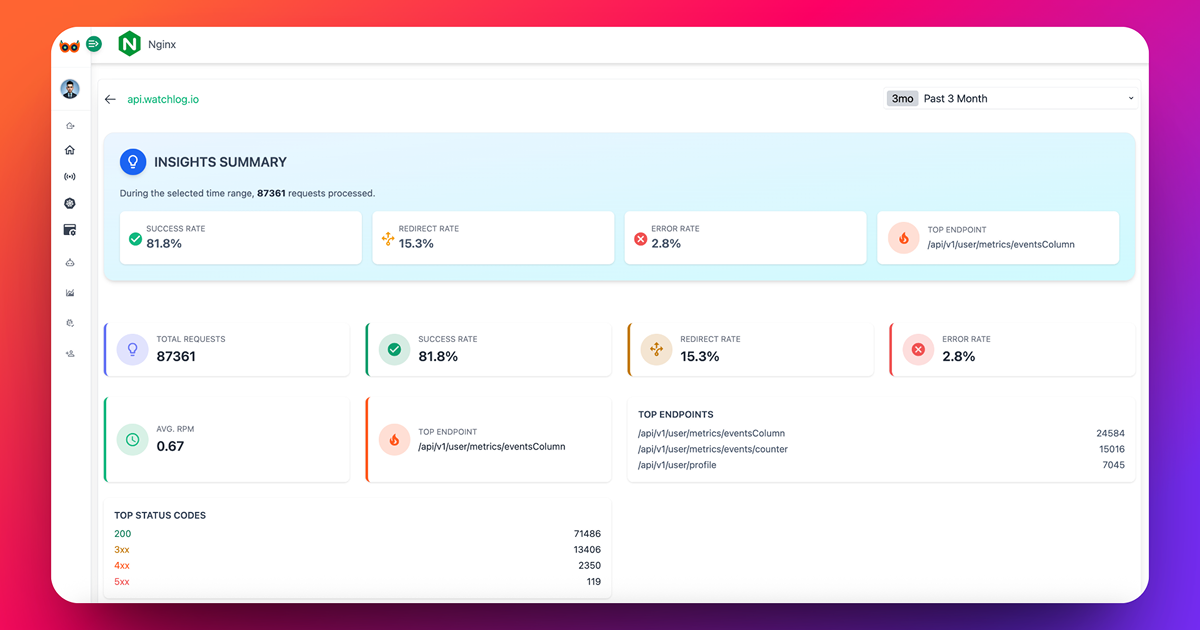
Here you’ll find key server health indicators:
Essential Metrics You Can Monitor:
- Active Connections – Gauge concurrent traffic and user activity
- Request Rate (req/sec) – Detect traffic spikes or DDoS behavior
- Average & Peak Response Times – Spot bottlenecks during high load
- 5xx Error Rate – See when upstreams or applications are failing
- Upstream Latency – Understand if backend APIs are slowing things down
- Bandwidth Usage – Track data in/out efficiency
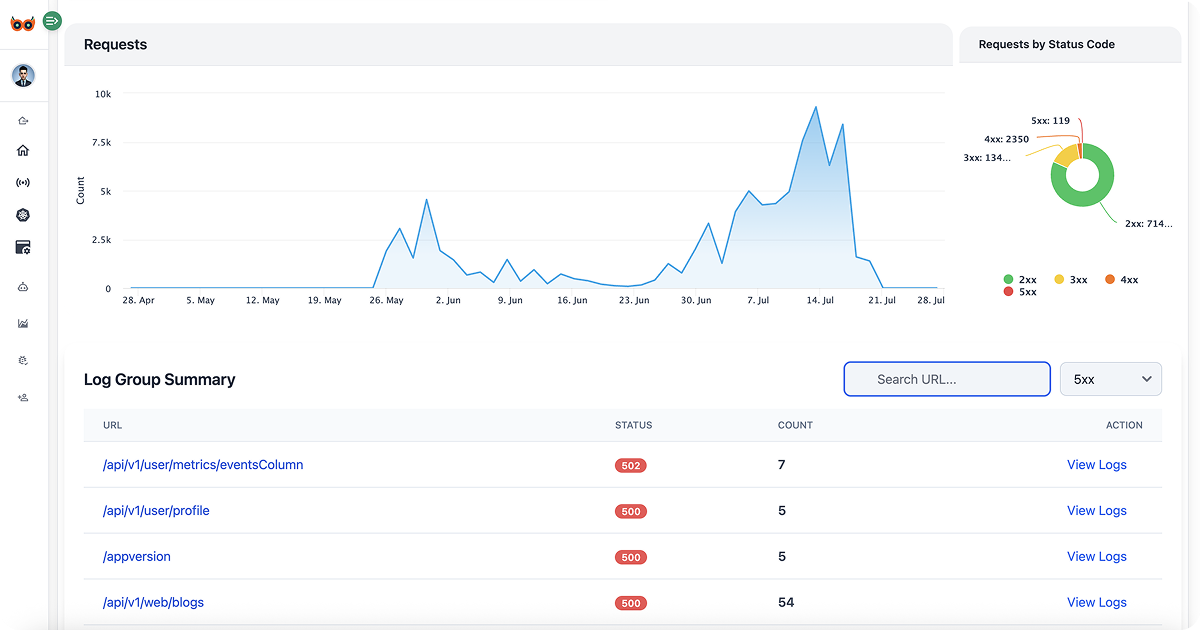
All metrics are graphed and searchable — allowing you to explore, filter, and drill down as needed.
Step 4: How to Troubleshoot and Optimize NGINX
Once metrics reveal where your issues lie, you can apply proven fixes:
🚨 High CPU Usage
Symptoms: High latency during load.
Fixes:
- Implement caching (FastCGI, CDN)
- Reduce log verbosity (
errororwarn)
Tune worker settings:
worker_processes auto;
worker_connections 1024;
🚨 Slow Response Times
Symptoms: High request_time or upstream_response_time
Fixes:
- Use reverse proxy caching
- Audit backend services for slow queries or timeouts
Enable gzip compression:
gzip on;
gzip_types text/plain text/css application/json;
🚨 Frequent 5xx Errors
Symptoms: Spikes in 500-series errors
Fixes:
- Check application logs for memory crashes or unstable deployments
- Monitor upstream availability using
nginx_status
Increase proxy timeouts:
proxy_connect_timeout 60s;
proxy_send_timeout 60s;
proxy_read_timeout 60s;
Step 5: Track Trends to Stay Ahead
Although Watchlog does not yet support real-time alerts, it offers powerful historical insights to detect trends early.
🕵️ Use the dashboard to:
- Analyze performance across time periods
- Detect regressions after code deploys
- Investigate high-error windows
- Compare infrastructure behavior across environments
The more consistently you review trends, the faster you’ll detect and prevent future outages.
Conclusion: Real-Time Monitoring for Modern NGINX Workloads
NGINX is fast, but without visibility, it becomes a black box.
Watchlog gives you a full-featured monitoring layer with zero setup complexity.
✅ Monitor live traffic, error rates, and latency with ease
✅ Drill down into upstream issues with logs and metrics
✅ Optimize performance using real server data — not guesswork
✅ Keep your infrastructure stable with proactive observability
🎯 Start monitoring your NGINX server with Watchlog today