Introduction (Problem-Led)
Your AI feature works in the demo and falls over in production. A request that normally returns in two seconds occasionally takes forty. Costs creep up with no obvious cause. A user reports a "weird answer" and you have no trace to look at. The model, the retrieval step, the tool calls, and the surrounding app code are all separate black boxes.
Traditional APM shows you the HTTP request succeeded. It does not show you which model was called, how many tokens it burned, why the agent looped three times, or where the latency actually went. AI apps need telemetry at the semantic layer — not just "did it run?" but "what did it decide, and what did it cost?"
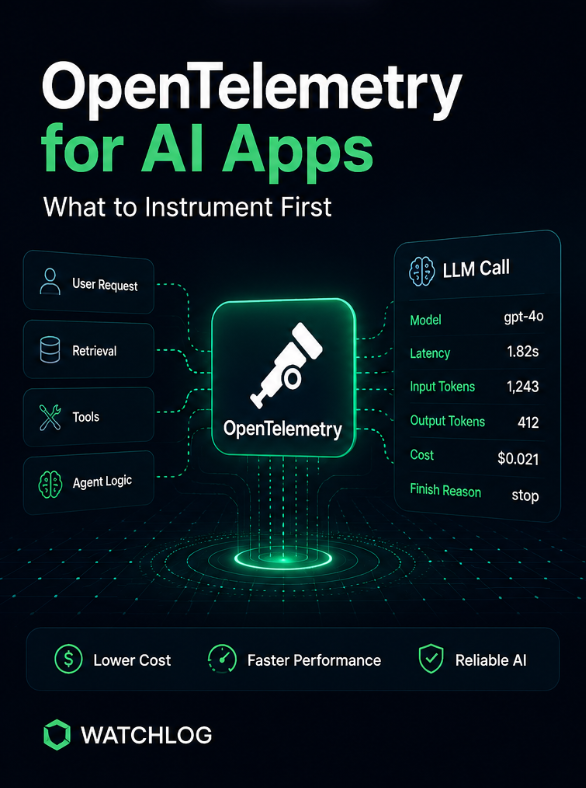
OpenTelemetry (OTel) is now the standard way to get that visibility with an open, vendor-neutral schema. But if you try to instrument everything on day one, you drown in noisy, oversized traces. This guide covers what to instrument first so you get signal fast without over-engineering.
Search Intent Answer Block
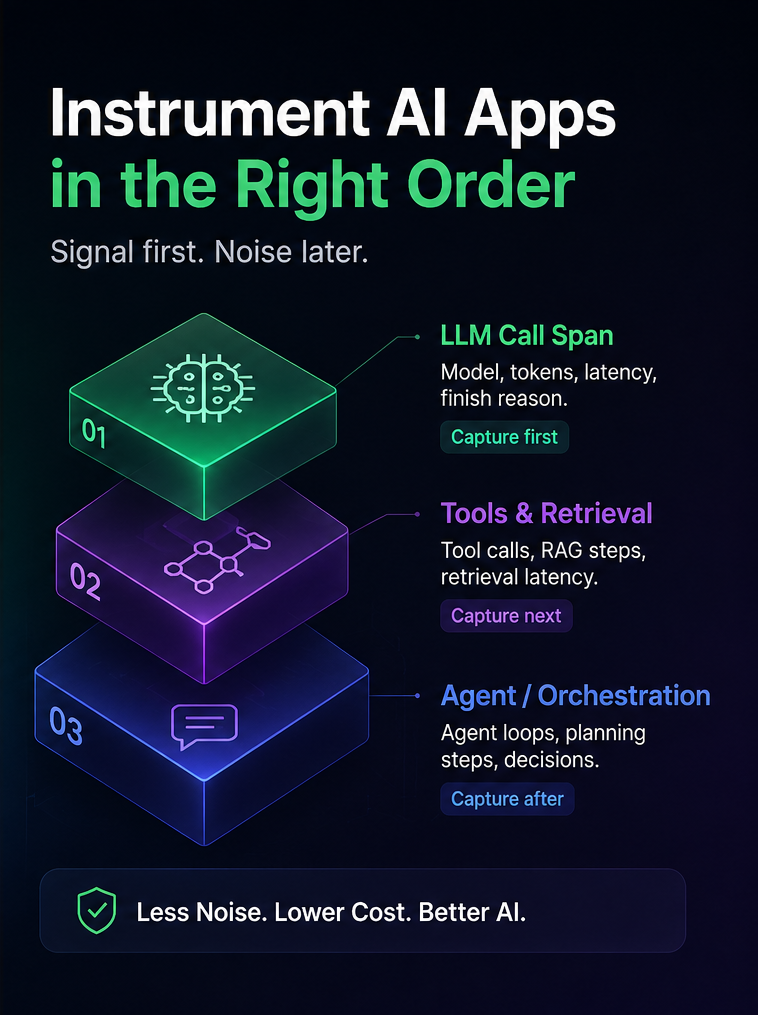
What should you instrument first in an AI app with OpenTelemetry? Start with the LLM client call span — model name, input/output tokens, latency, and finish reason — using the OTel GenAI semantic conventions (gen_ai.*). Once that's stable, add tool-call and retrieval spans, then agent/orchestration spans so the whole request is one connected trace. Capture prompt and completion content last and selectively, because it's large and often sensitive. In short: instrument the money-and-latency signals first, the reasoning graph second, and raw content only where you need it for debugging.
Commercial Impact
Under-instrumented AI apps cost you in three ways that compound:
- Spend you can't attribute. Token usage is the meter running on every request. Without per-request token and model visibility, cost overruns show up on the invoice, not in your dashboards.
- Latency you can't diagnose. LLM and agent calls dominate end-to-end latency. If you can't see time-to-first-token, per-step duration, and retry loops, you're guessing at what to optimize.
- Reliability you can't trust. Agents can fail silently — return HTTP 200 while producing a wrong or unsafe answer. That's a reliability and safety problem your uptime check will never catch.
For a small team shipping AI features, the difference between "we saw the cost spike within the hour" and "we saw it on next month's bill" is real margin.
What Teams Usually Get Wrong
- Instrumenting everything at once. Capturing full prompts and completions on every span from day one produces huge, expensive, hard-to-read traces.
- Rolling their own attribute names. Custom keys like
my_modelandllm_tokensmean every dashboard and library speaks a different language, and you re-instrument every time you switch a tool. - Tracing the LLM call in isolation. A bare LLM span with no parent leaves you unable to connect the model call to the user request, the retrieval step, or the tool execution that triggered it.
- Logging prompts with PII in plain text. Prompt/completion content frequently contains user data. Capturing it carelessly creates a privacy and compliance problem.
- No sampling strategy. Recording 100% of content-heavy traces forever is neither useful nor affordable.
What to Monitor (Prioritized Checklist)
Instrument in this order:
Tier 1 — LLM client call (do this first)
gen_ai.operation.name(e.g.chat,text_completion)gen_ai.request.modelandgen_ai.response.modelgen_ai.usage.input_tokensandgen_ai.usage.output_tokens- Latency of the call (and time-to-first-token for streaming)
gen_ai.response.finish_reasons(e.g.stop,tool_calls,length)- Request params where relevant:
gen_ai.request.temperature,gen_ai.request.top_p
Tier 2 — the reasoning graph
- Tool/function-call spans (
execute_tool) with tool name and duration - Retrieval / vector-search spans (query, top-k, retrieval latency)
- Agent / orchestration span (
invoke_agent) as the parent that ties the trace together
Tier 3 — content and quality (selective)
- Prompt and completion content (
gen_ai.input.messages,gen_ai.output.messages,gen_ai.system_instructions) — sampled, redacted, and only where you need it - Quality/safety signals: hallucination indicators, relevance, toxicity, PII detection, prompt-injection detection
Step-by-Step Framework
Step 1 — Adopt the GenAI semantic conventions. The OpenTelemetry GenAI Special Interest Group (formed in April 2024) maintains a standard gen_ai.* attribute schema so a span from a framework looks the same as one from a raw provider SDK. As of mid-2026 most of these conventions are still marked experimental, so pin your convention version and use OTEL_SEMCONV_STABILITY_OPT_IN to dual-emit legacy and new attribute names during upgrades.
Step 2 — Auto-instrument the provider SDK. The OpenAI Python instrumentation is the most mature today; Anthropic, Cohere, and Bedrock are covered by community libraries, and OpenAI-compatible gateways (e.g. LiteLLM) can auto-trace many providers at once. Overhead is typically under ~1% and negligible relative to multi-second model calls.
Step 3 — Establish the trace root. Make the incoming user request (HTTP handler, job, or agent invocation) the parent span so every LLM call, tool call, and retrieval nests under one trace. This is what turns disconnected spans into a readable request timeline.
Step 4 — Add tool and retrieval spans. Wrap each tool execution and each retrieval step in its own child span. This is where you'll catch retry loops, slow tools, and bad retrievals.
Step 5 — Export tokens as metrics, not just span attributes. Emit token counts as metrics and split by gen_ai.token.type (input vs output) so you can chart per-model usage, estimate cost, and alert on spikes without scanning every trace.
Step 6 — Add content capture and sampling last. Turn on message/completion capture selectively, redact PII before it leaves the process, and sample content-heavy traces. Route everything through an OTel Collector so you can filter, redact, and control cost centrally.
How Watchlog Helps
Watchlog is built for small teams that want full-stack observability — infrastructure, logs, APM and distributed tracing, RUM, uptime, Kubernetes, and GenAI monitoring — in one platform instead of a stack of disconnected tools. For AI apps, that unification matters: the model call rarely fails alone. It fails alongside a slow database, a saturated pod, or a downstream API timeout, and Watchlog's cross-signal correlation connects logs, metrics, and traces so you see the whole picture, while AI-assisted incident analysis helps explain the likely root cause and recommended next step rather than just summarizing what broke.
On the AI side specifically, Watchlog's documented GenAI monitoring focuses on LLM interaction quality and safety — hallucination detection, relevance/text similarity, PII detection, prompt-injection detection, sentiment, toxicity, topic classification, and readability — accessed via a GenAI Control Room API with real-time and async modes. That maps directly to Tier 3 above.
Verify before publishing: Whether Watchlog ingests OpenTelemetry/OTLP directly, and whether it tracks operational LLM metrics (per-request/per-model tokens, cost, and latency) or framework traces (LangChain, RAG, agent tool-calls), must be confirmed with the product team. Do not state these as live capabilities until confirmed. Until then, present token/cost/latency as the market problem teams should be solving.
Example Scenario
A 12-engineer SaaS team ships an AI support assistant. Users start reporting slow, occasionally wrong answers. With OTel instrumentation in place, one trace tells the story: the invoke_agent span shows the agent called a retrieval tool twice (a retry), the second chat span used a larger fallback model, gen_ai.usage.output_tokens was 4× normal, and finish_reasons was length — the model was truncating. The fix (tighter retrieval + a token cap) is obvious because the trace is connected. Correlated infra signals confirm the vector store was under memory pressure during the spike — which is why unified observability beats an LLM-only tracing tool that can't see the database.
Comparison / Alternatives
- LLM-only tracing tools capture rich model traces but leave you blind to the infrastructure and app signals that AI incidents usually involve.
- DIY OTel + a general backend is flexible and open, but small teams end up owning collectors, storage, dashboards, and alerting themselves.
- Enterprise observability suites cover everything but bring cost and complexity that priced-out startups struggle with.
Watchlog's fit is the practical middle: unified coverage across AI, app, and infra signals, fast setup, and predictable cost — full-stack observability without the full-stack bill. (Confirm OTel ingestion specifics before positioning Watchlog as a drop-in OTel backend.)
Internal Links
- OpenTelemetry Observability for Small Teams (pillar)
- APM for Startups
- GenAI Monitoring
- Startup Observability Stack
- Pricing
FAQ
Q: What's the single most important thing to instrument in an AI app first?
The LLM client call — model, input/output tokens, latency, and finish reason. It gives you cost and latency signal immediately with minimal effort.
Q: Are the OpenTelemetry GenAI semantic conventions stable yet?
As of mid-2026 most are still experimental and evolving. Pin your convention version and use the stability opt-in to dual-emit attribute names so upgrades don't break dashboards.
Q: Does OTel instrumentation slow my app down?
Overhead is typically under ~1% and negligible next to multi-second model calls, especially with async batch export via a collector.
Q: Should I capture full prompts and completions?
Only selectively. Content is large and often contains PII — sample it, redact before export, and enable it where you genuinely need debugging depth.
Q: What about token cost and per-model spend?
Export tokens as metrics split by input/output and model so you can estimate cost and alert on spikes. (For Watchlog's specific support of cost/token metrics, verify with the product team.)
Q: Do I need a separate tool for AI vs infrastructure monitoring?
Not necessarily — AI incidents usually involve infra and app signals too, which is why unified, correlated observability is often more useful than an AI-only tracer.