Node.js Monitoring – The Complete Guide for Developers

Why Node.js Monitoring Matters
In the fast-paced world of modern software, Node.js monitoring is no longer optional—it’s a necessity. Whether you are running a simple API or a large-scale distributed microservices architecture, having deep visibility into your Node.js application performance, server health, and error tracking is critical to ensuring uptime, reliability, and cost efficiency.
With the right monitoring strategy, developers can:
- Detect performance bottlenecks before users notice.
- Optimize resource usage and reduce cloud costs.
- Maintain uptime through proactive alerting.
- Improve development workflows with actionable insights.
One of the most effective approaches is combining agent-based server monitoring, custom events, and Application Performance Monitoring (APM) for Node.js. In this guide, we’ll explore all these areas—and how Watchlog makes them simple.
1. Server and Agent-Based Monitoring for Node.js
Before diving into advanced features, let’s start with the basics: server monitoring.
Why it’s important:
A slow Node.js application isn’t always caused by bad code—it could be the server’s CPU maxing out, low memory availability, or slow disk I/O. With agent-based monitoring, you can collect key system metrics, including:
- CPU usage
- Memory consumption
- Disk space and I/O
- Network throughput
- Active connections
An agent runs on the server where your Node.js app is deployed. It collects metrics in real time and sends them to a centralized dashboard for analysis. Watchlog’s one-command agent installation works on Linux environments, making it perfect for both local and cloud-based deployments.
With this approach, you not only monitor your Node.js app but also understand the full server context, which is essential for diagnosing performance issues quickly.
While system metrics are valuable, you often need to track custom application-level events to gain deeper insights.
Examples of custom events:
- Tracking the number of orders placed per hour in an e-commerce platform.
- Logging user signup spikes during a marketing campaign.
- Measuring background job execution times.
With Watchlog’s Node.js integration, sending a custom event is as simple as calling a function from the Watchlog SDK:
Installation
npm install watchlog-metricUsage
const watchlog = require("watchlog-metric");

// Increment a metric by a value (default is 1)
watchlog.increment("Your_metric");
watchlog.increment("Your_metric", 75);

// Decrement a metric by a value (default is 1)
watchlog.decrement("Your_metric");
watchlog.decrement("Your_metric", 25);

// Record a percentage (value between 0 and 100)
watchlog.percentage("Your_metric", 12.23);

// Record a gauge (numeric value)
watchlog.gauge("Your_metric", 12.23);

// Record system bytes (e.g., for memory or bandwidth)
watchlog.systembyte("Your_metric", 1024000000); // 1 GB
Custom events allow you to correlate application-level behavior with system performance metrics. For example, a spike in signups might explain sudden CPU load or database slowdowns.
This gives your team full observability—from server health to specific business KPIs.
Basic monitoring tells you when something is wrong. APM (Application Performance Monitoring) tells you why.
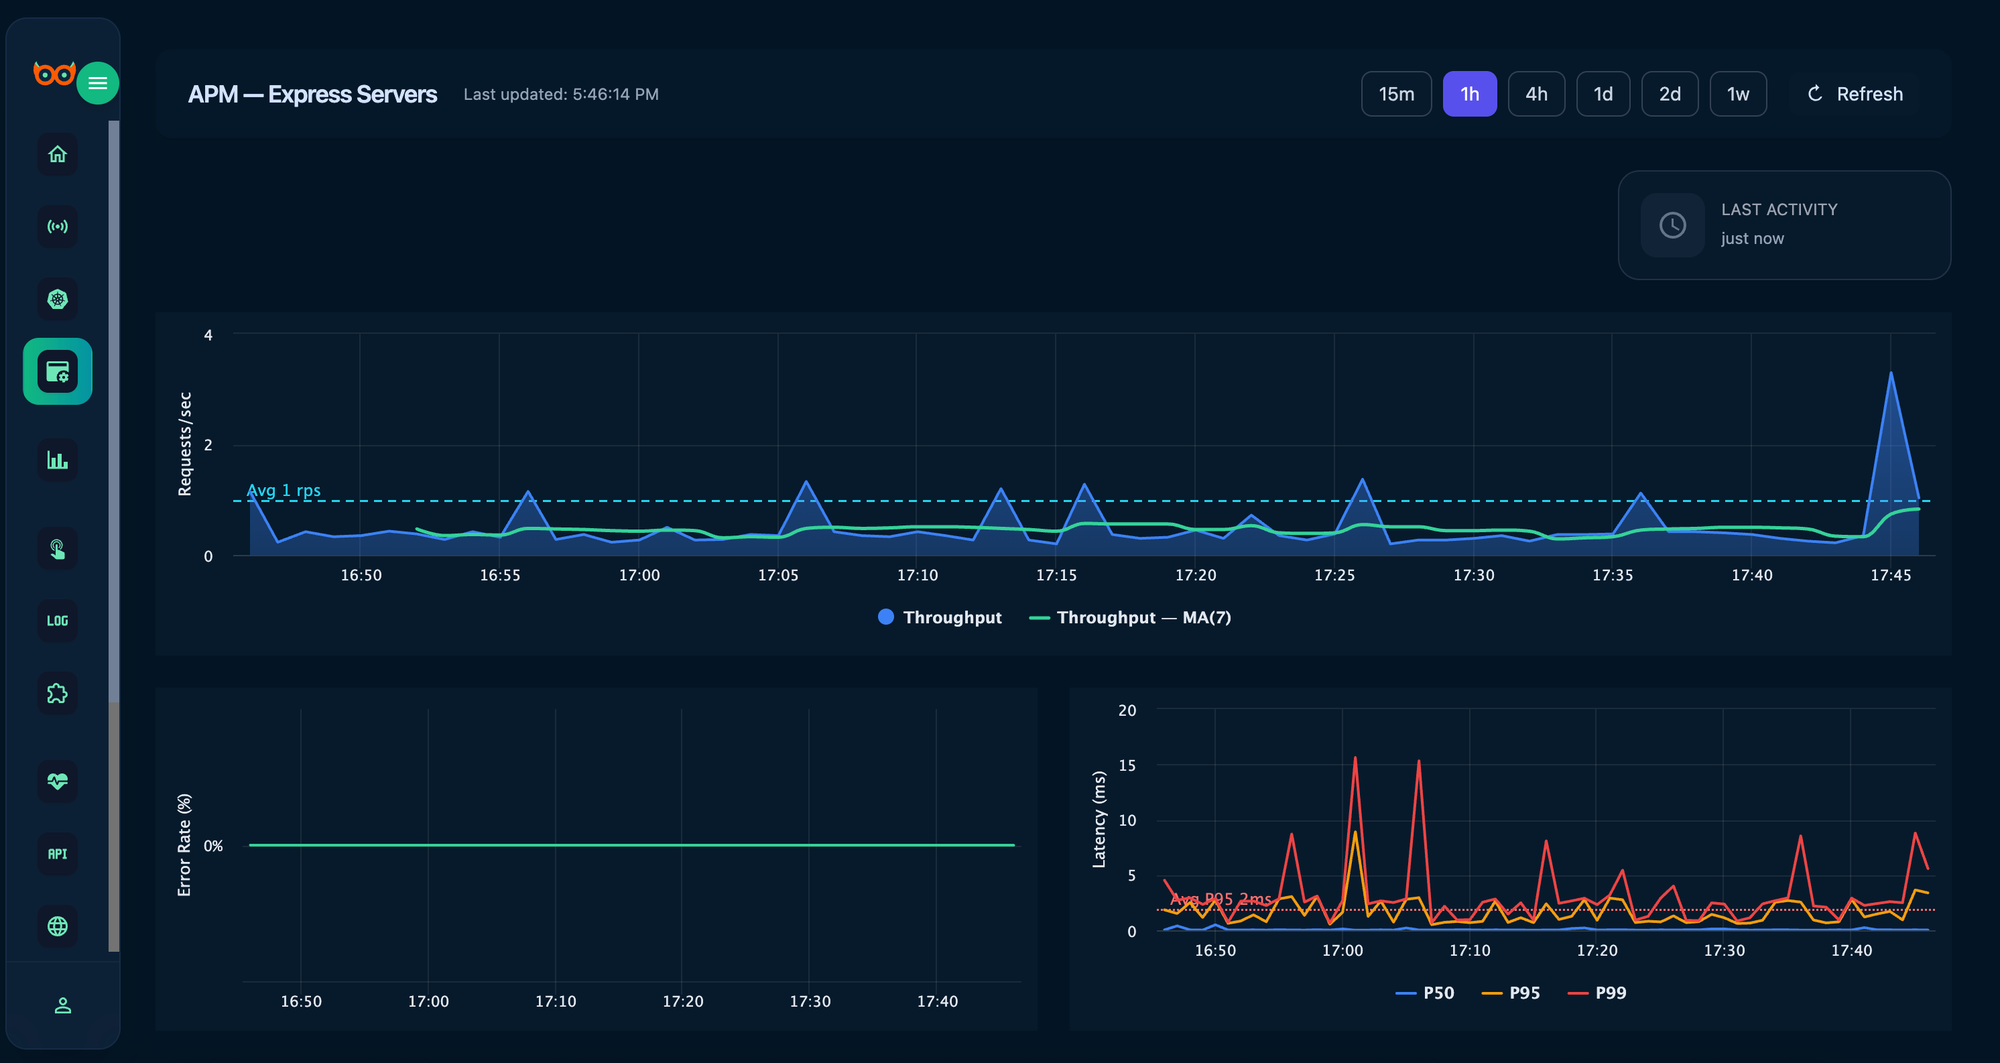
With Node.js APM, you can monitor:
- Request throughput (requests per second)
- Average and maximum response times
- Error rates and top failing endpoints
- Database query performance
- Memory leaks and long event loops
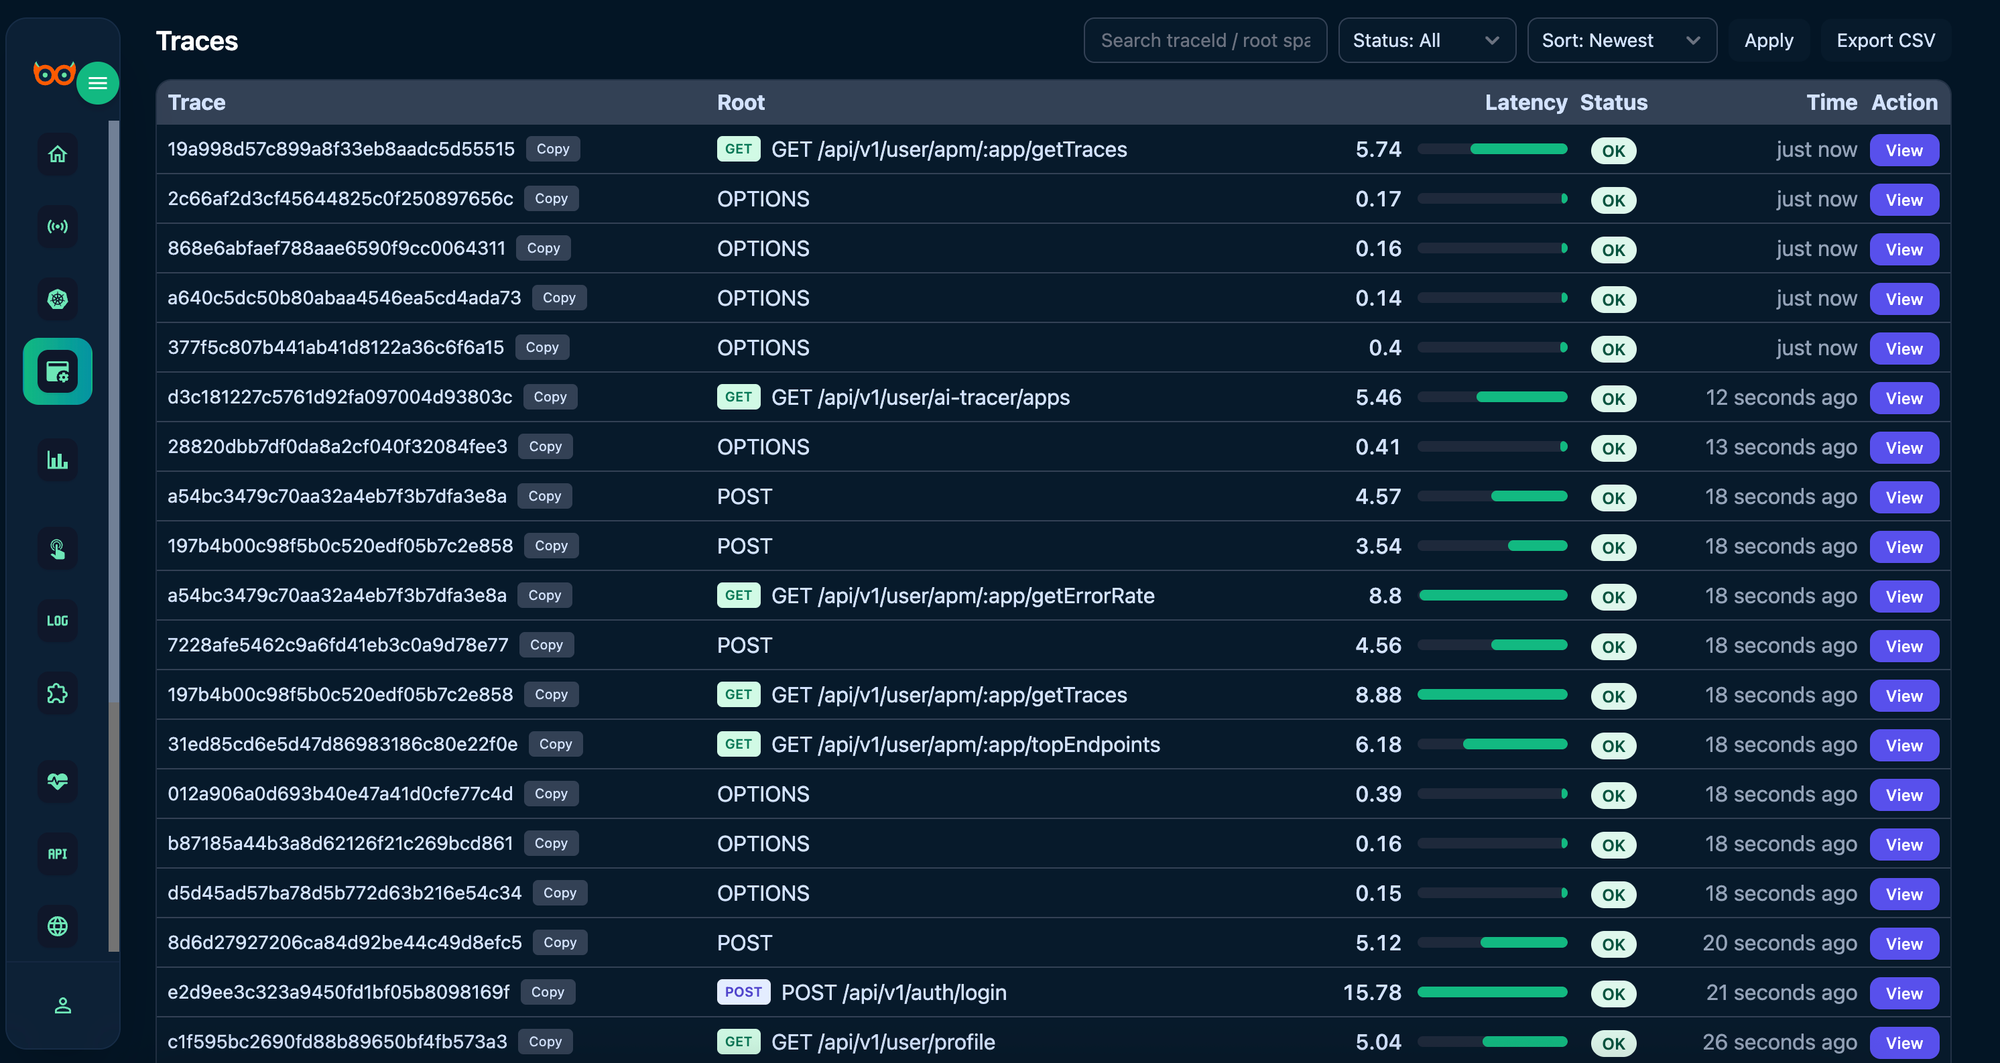
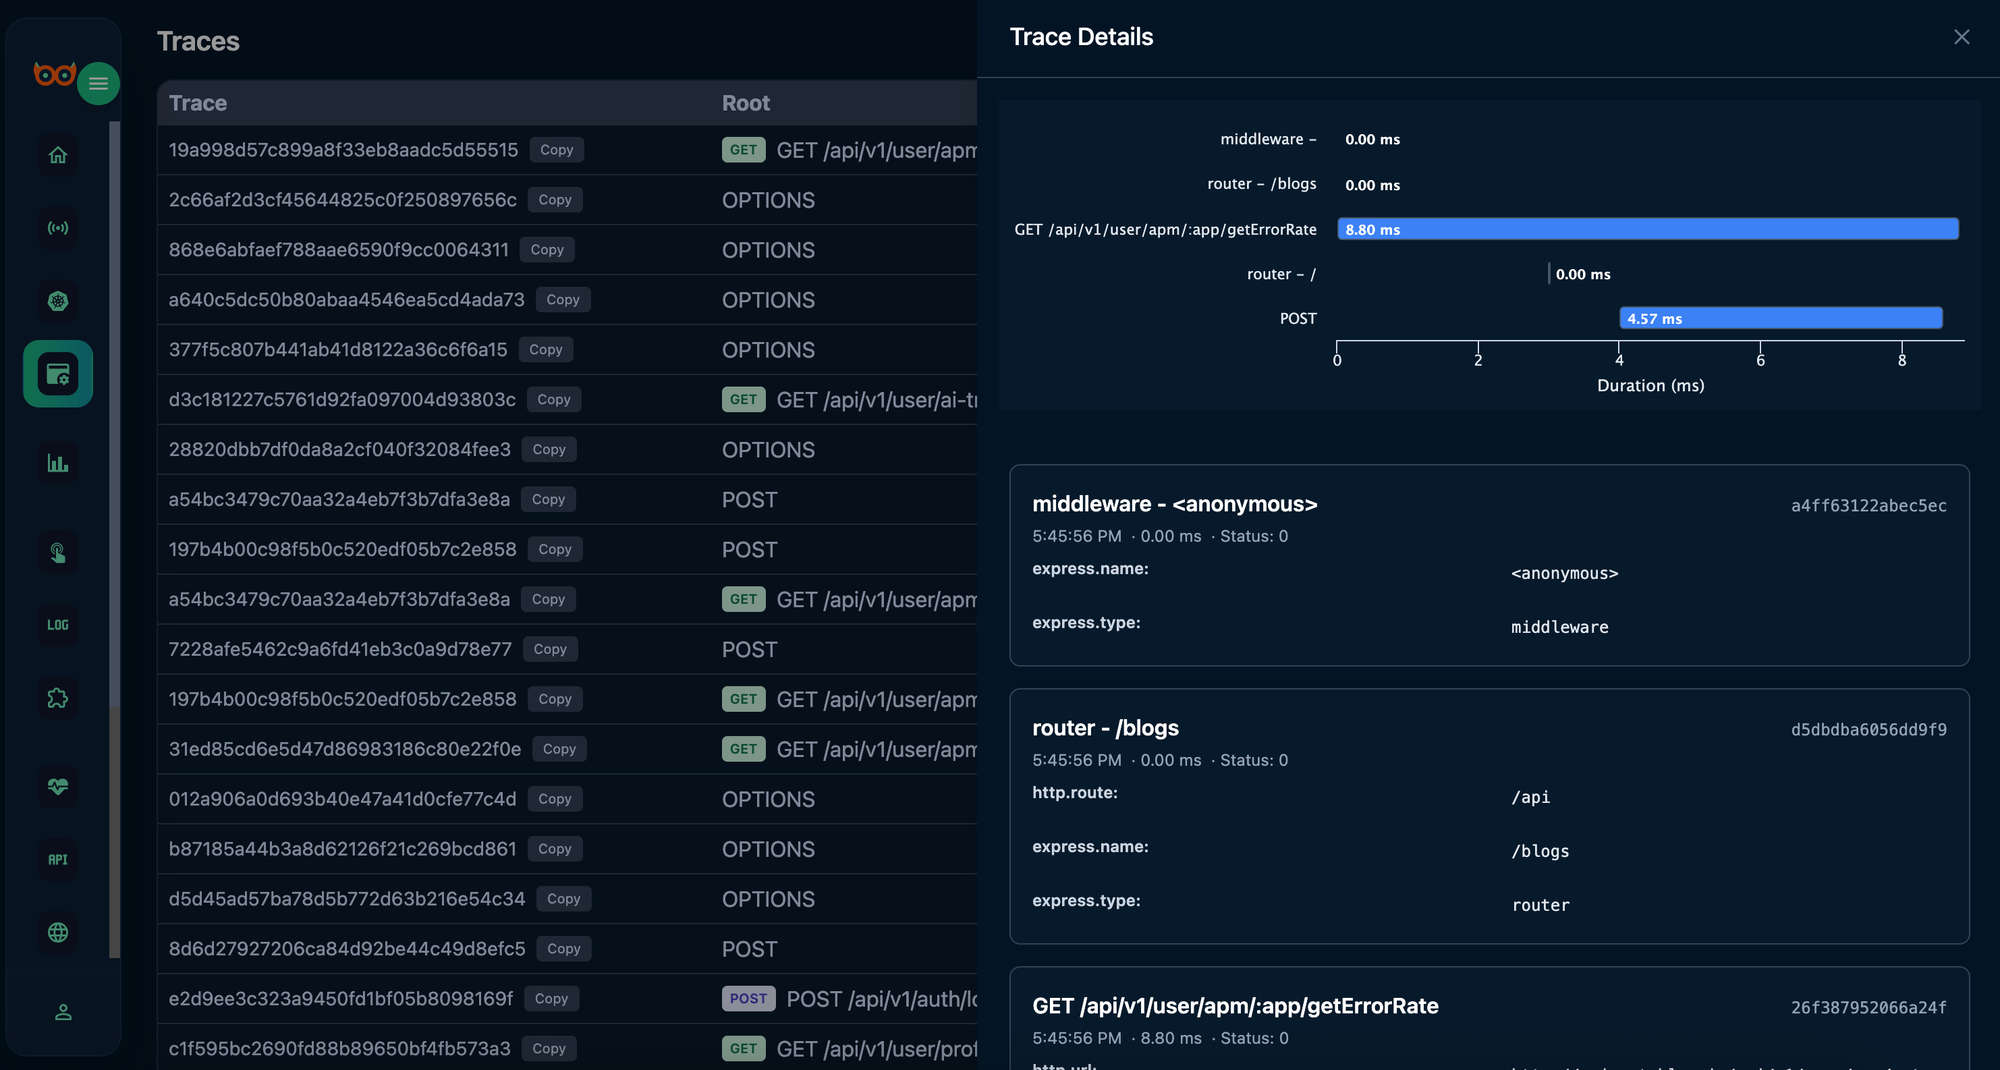
Advanced APM tools like Watchlog’s @watchlog/apm-node package automatically instrument your Node.js app without requiring major code changes. It captures:
- End-to-end request traces.
- Errors with full stack traces.
- Slow API calls and queries.
Installation
npm install @watchlog/apm
Usage
// index.js — must be first
const { instrument } = require('@watchlog/apm');

// Initialize with your service name and options
const sdk = instrument({
  app: 'my-service',          // your application name
  errorTPS: 5,                // max 5 error spans/sec
  sendErrorTraces: true,      // always send error spans
  slowThresholdMs: 300,       // always send spans slower than 300ms
  sampleRate: 1               // random sample rate (0.0–1.0, capped at 0.3)
});

// Continue loading your application
const express = require('express');
const app = express();

app.get('/', (req, res) => res.send('Hello World!'));
app.listen(3000, () => console.log('Listening on 3000'));
For example, if your /checkout endpoint starts taking 2 seconds instead of 200ms, APM can pinpoint whether the cause is a slow database query, third-party API delay, or blocking code.
This level of insight is crucial for optimizing application performance, especially in production environments where every millisecond counts.
APM Dashboard in Watchlog
One of the most effective approaches is combining agent-based server monitoring, custom events, and Application Performance Monitoring (APM) for Node.js
APM Dashboard In Watchlog
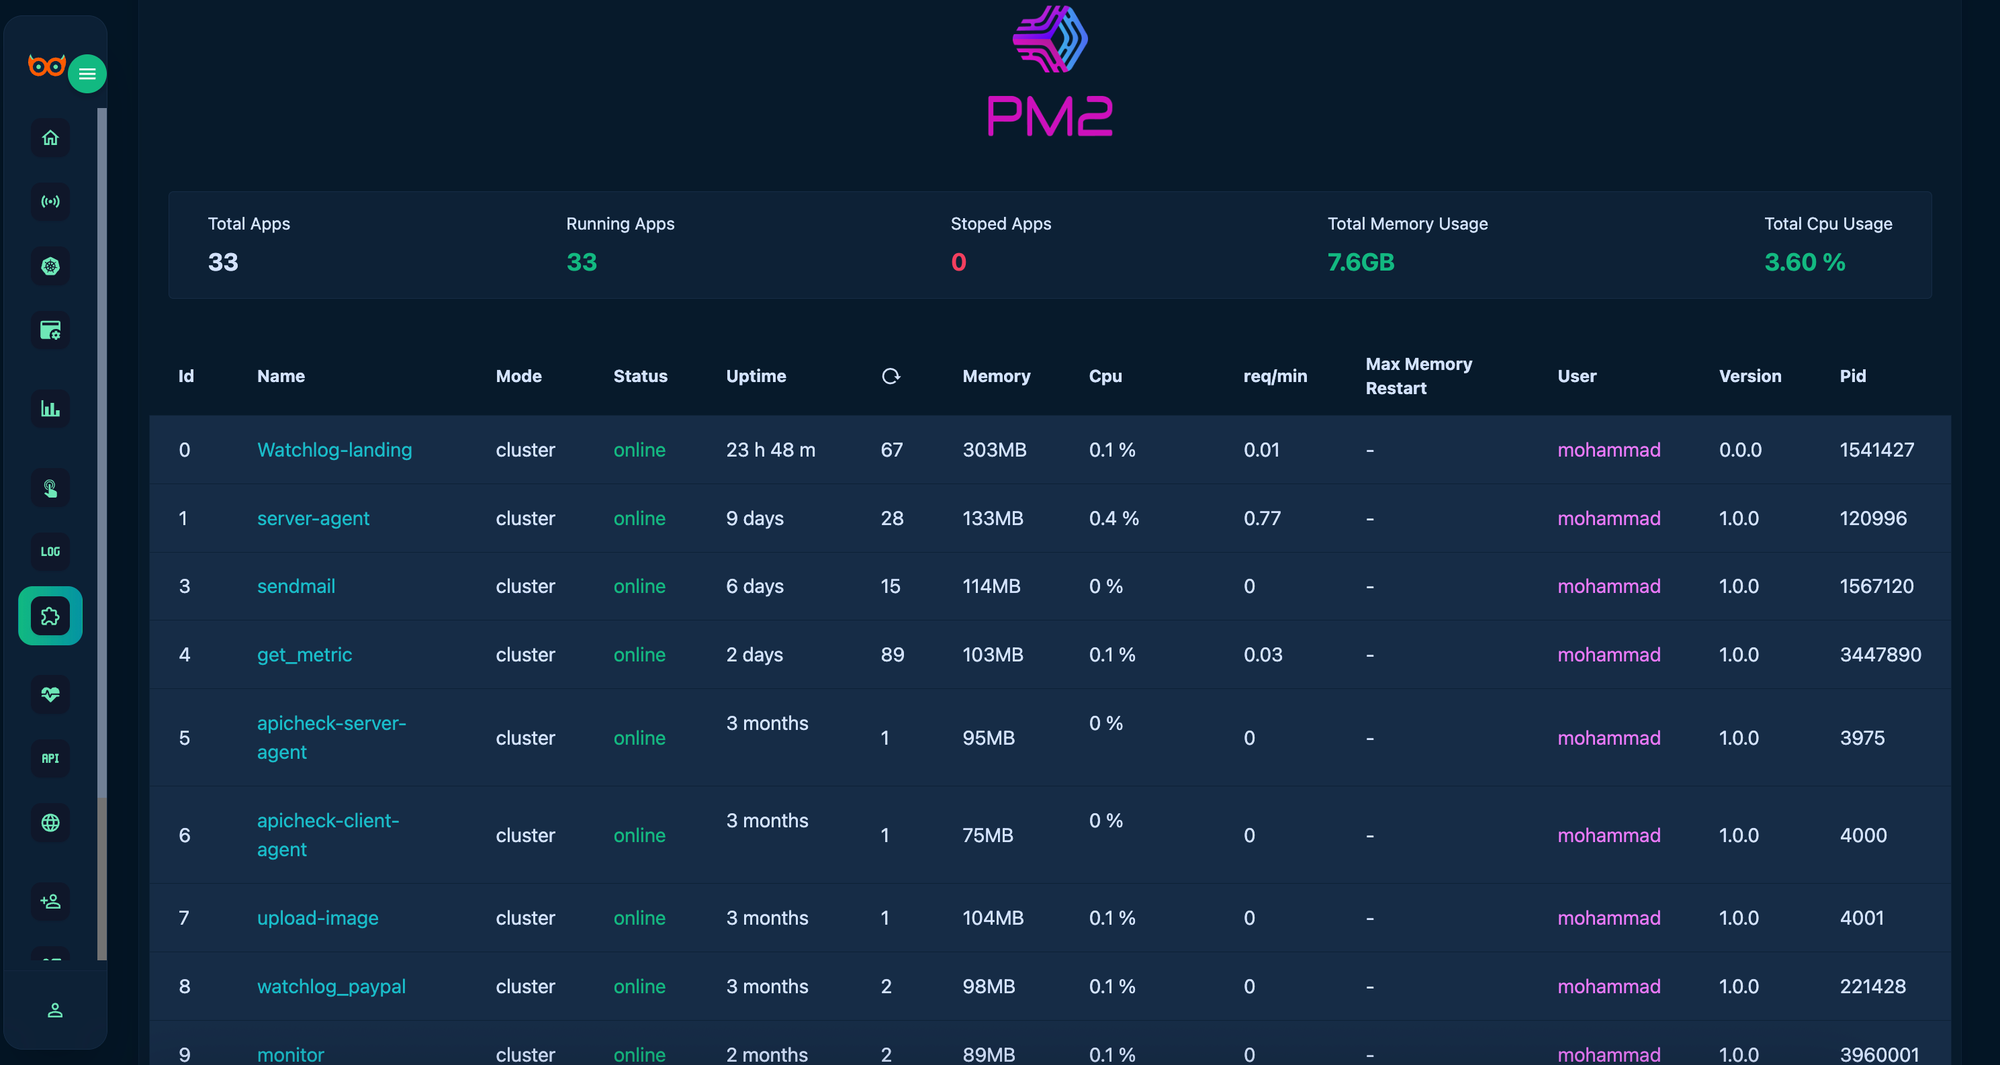
4. PM2 Integration for Node.js Process Monitoring
If you run your Node.js applications with PM2, you already benefit from process management features like auto-restart, clustering, and logging.
But you can take it a step further by integrating PM2 with Watchlog. This enables:
- Real-time process metrics (CPU, memory per process).
- Error tracking from PM2 logs directly in the monitoring dashboard.
- Alerting when a process crashes or restarts unexpectedly.
With Watchlog’s PM2 integration, you gain visibility into both application-level health and system performance, all in one place.
Final Thoughts
A complete Node.js monitoring strategy goes beyond just checking uptime. By combining server monitoring, custom event tracking, APM, and PM2 integration, you can detect problems early, troubleshoot faster, and deliver a consistently high-quality experience to your users.
Watchlog makes this process seamless with its lightweight agent, easy SDK integrations, and powerful dashboard. Whether you’re scaling a SaaS platform or maintaining an internal enterprise app, the right monitoring setup can be the difference between hours of downtime and uninterrupted service.
Gain deep insights with real-time Node.js performance monitoring, custom event tracking, and PM2 integration—all in one powerful platform.
Sign up for free on Watchlog and take your application’s performance to the next level!