Monitoring Django Performance with WATCHLOG


Monitoring and optimizing the performance of Django applications is critical for maintaining scalability, reliability, and a seamless user experience. As web applications grow, developers face challenges in Django server monitoring, tracking resource usage, and detecting performance bottlenecks before they affect users. This is where a robust monitoring solution like WATCHLOG becomes essential.
In this article, we’ll explore how you can effectively monitor Django using WATCHLOG — starting with server and agent monitoring, moving to custom event tracking, and finally diving into advanced Django APM (Application Performance Monitoring)..
1. Django Server Monitoring with WATCHLOG Agent
The first step in Django monitoring is ensuring that your server health and resource consumption are under control. With WATCHLOG’s lightweight Agent, you can easily track metrics such as:
- CPU and Memory usage – detect high consumption from specific Django processes.
- Disk and Network I/O – avoid storage saturation and optimize throughput.
- Server uptime tracking – make sure your Django app is always available.
The WATCHLOG Agent runs seamlessly on your server, collecting real-time performance data and pushing it to your dashboard. This ensures you have full visibility into your Django infrastructure, helping you quickly detect downtime or misconfigurations.
2. Sending Custom Events in Django
While server monitoring is crucial, many teams need to track application-specific metrics in Django. WATCHLOG enables developers to send custom events directly from their Django application, such as:
- Monitoring user registrations or payment transactions.
- Tracking critical function execution times.
- Logging custom errors beyond default Django logs.
By leveraging WATCHLOG’s event system, you can create custom alerts and thresholds — for example, notifying your team if login failures spike or if API response times exceed acceptable limits. This makes Django event monitoring much more flexible and tailored to your unique business logic.
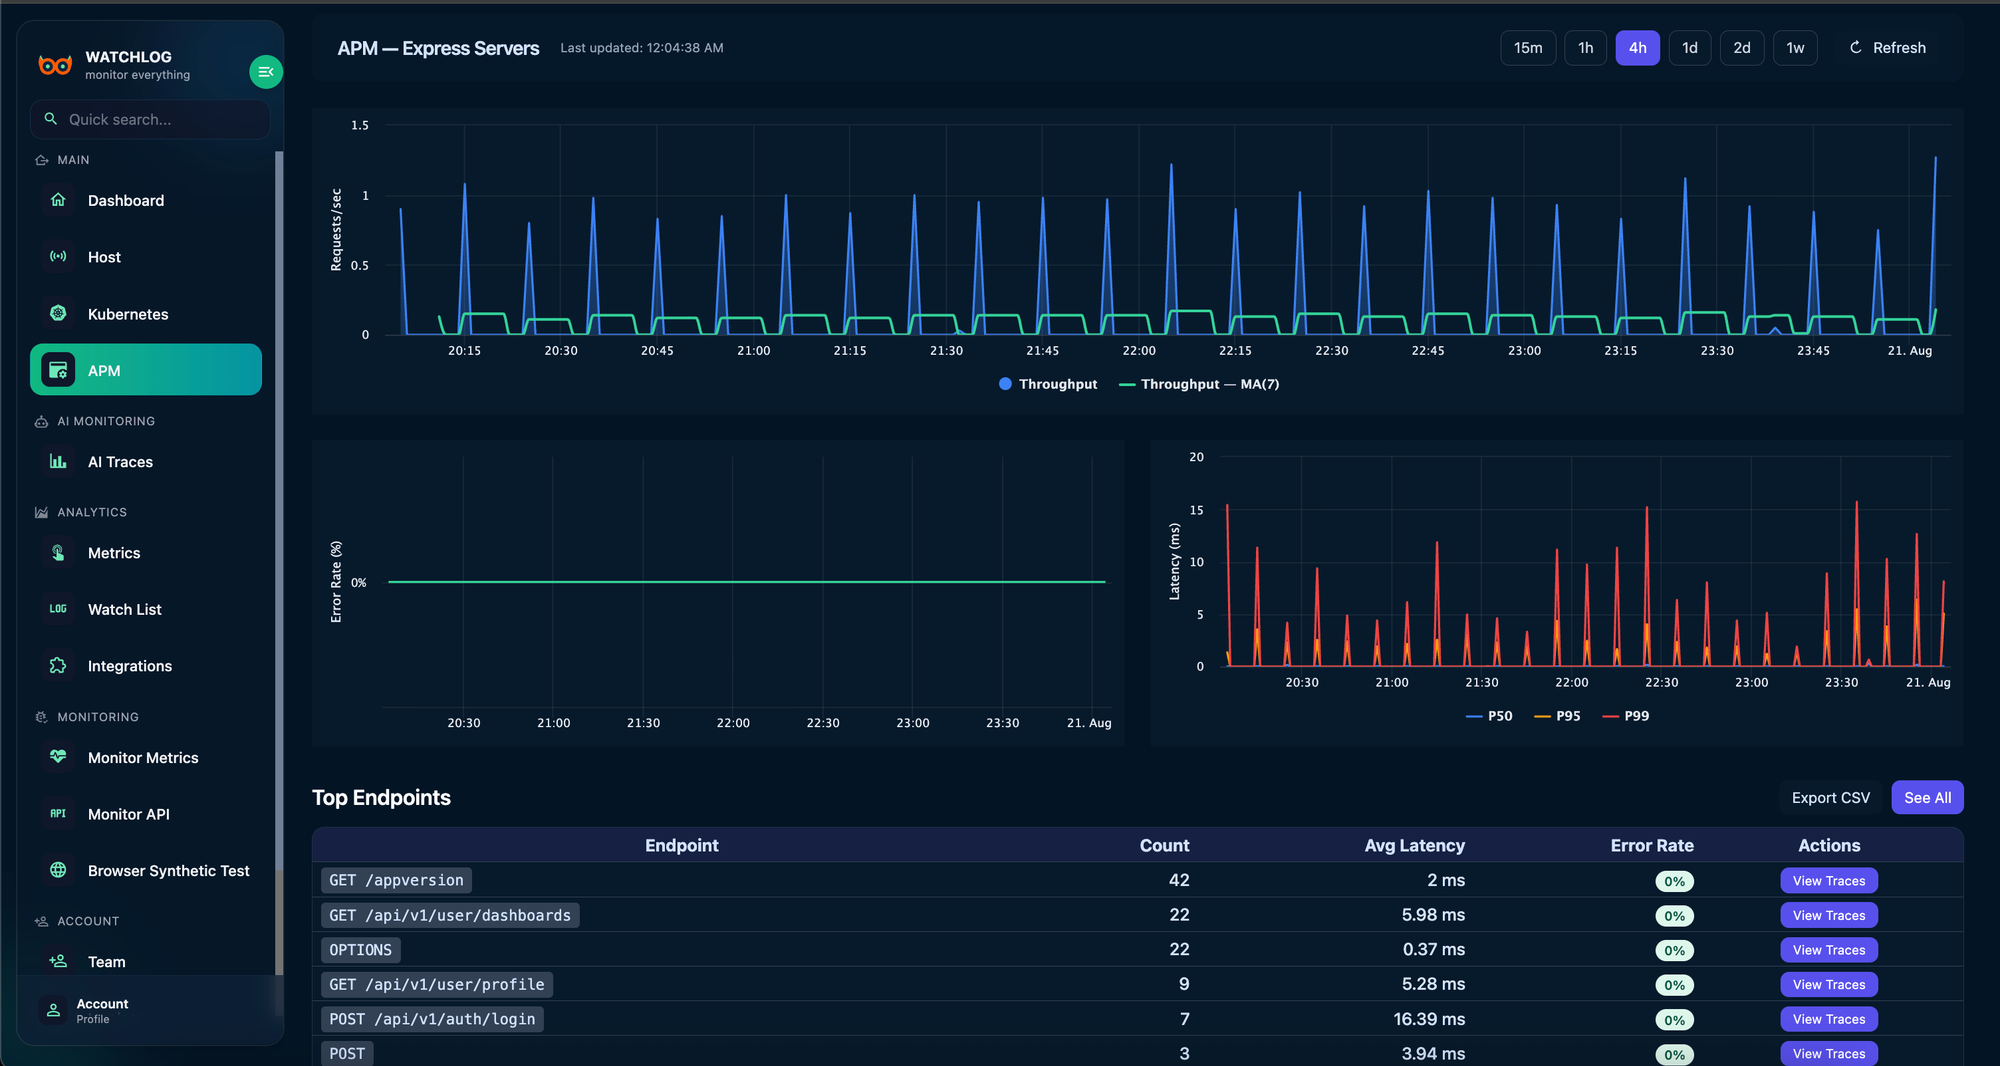
3. Advanced Django APM (Application Performance Monitoring)
Beyond server health and events, true visibility into Django applications comes from APM (Application Performance Monitoring). WATCHLOG’s Django APM integration gives you deeper insights into:
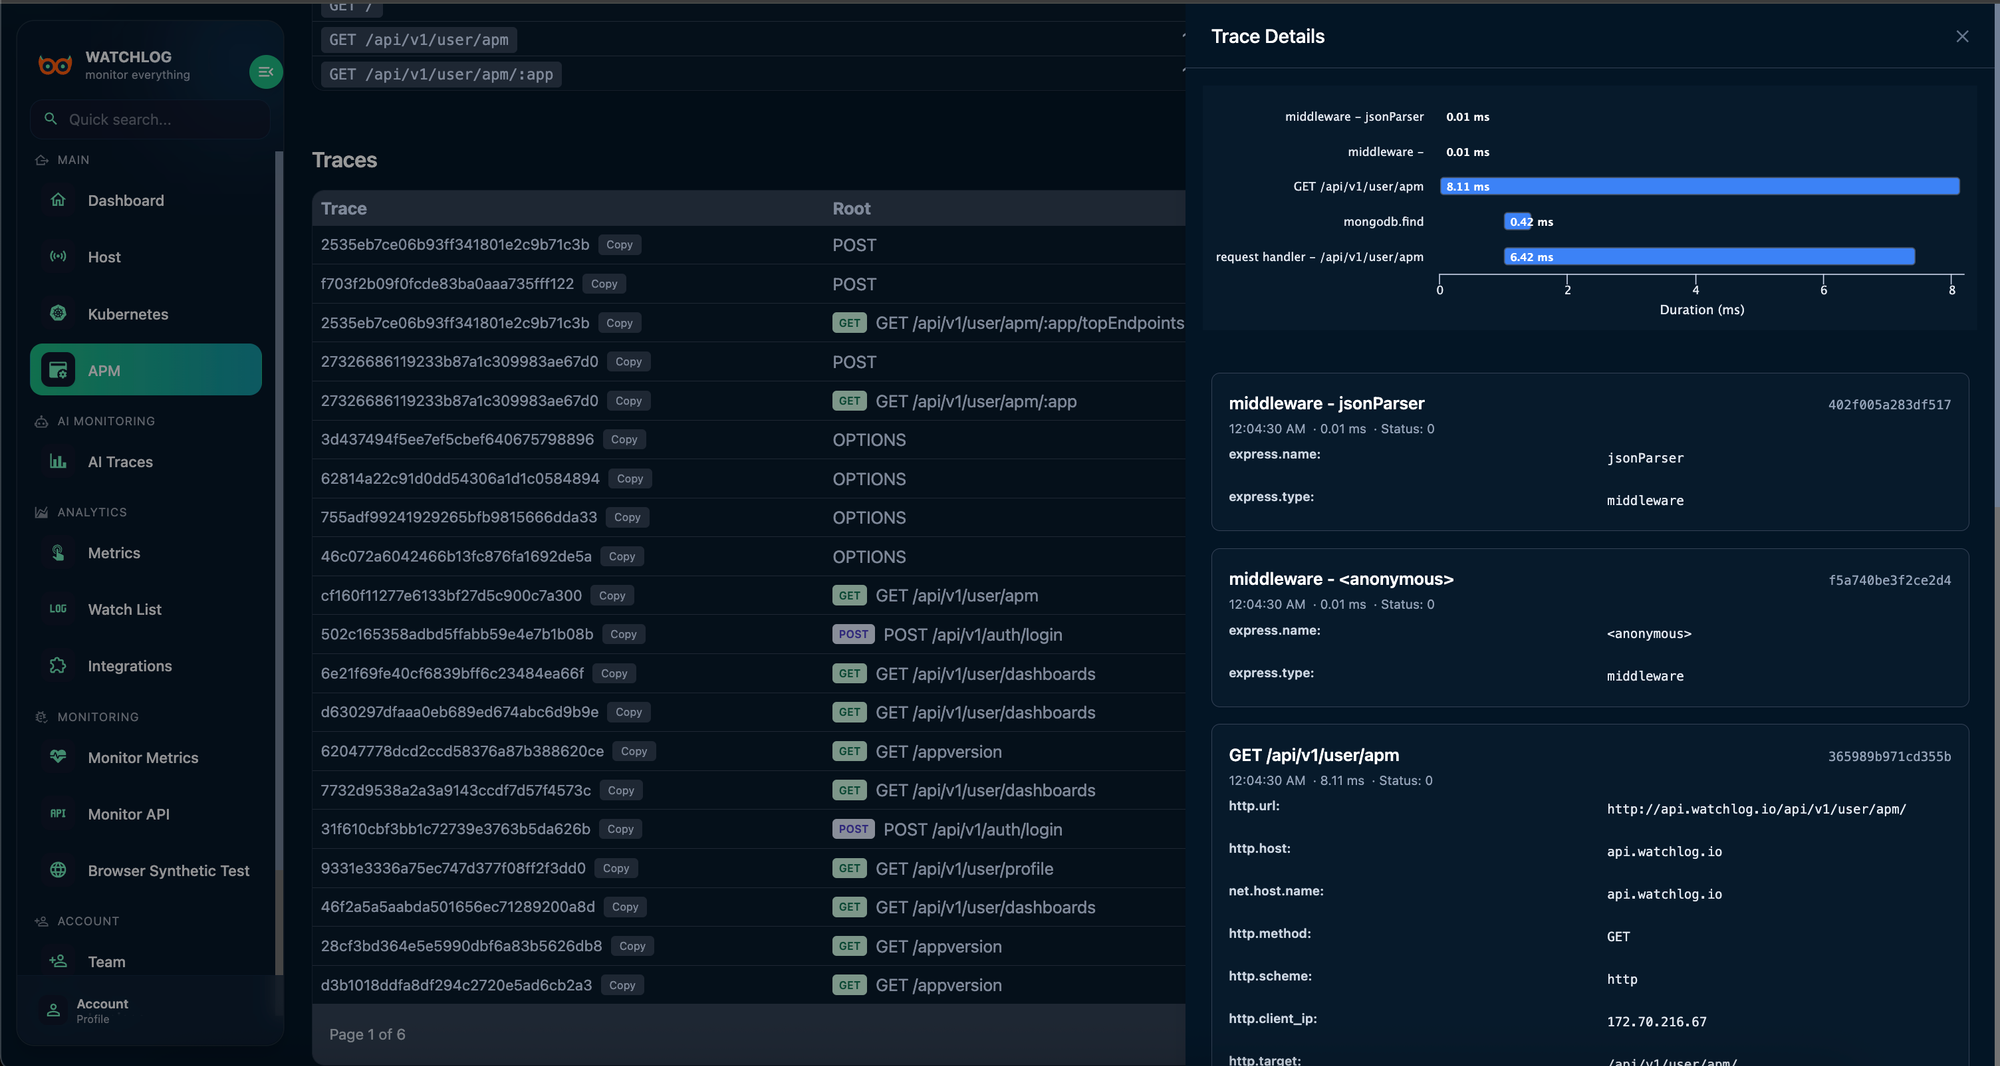
- Request tracing – see how each request flows through views, middleware, and database queries.
- Error tracking – identify and debug Django exceptions with detailed stack traces.
- Database performance – analyze slow queries and optimize ORM performance.
- External API monitoring – detect latency when your Django app depends on third-party services.
With APM, you can uncover bottlenecks inside your Django project that traditional logging and monitoring tools often miss. This ensures better performance, higher availability, and optimized user experience.
4. How to Install and Connect Django with WATCHLOG
Getting started with Django monitoring in WATCHLOG is simple. Once you’ve created an account on WATCHLOG, you need to install the Watchlog Agent on your server and then configure your Django application to send custom events and performance metrics.
Here’s a quick step-by-step guide:
Step 1: Installation
pip install django-watchlog-apm
Step 2:Usage
# wsgi.py (or asgi.py)
import os
from django.core.wsgi import get_wsgi_application  # or get_asgi_application

# 1) Instrumentation before Django setup
from django_watchlog_apm.instrument import instrument_django

instrument_django(
    service_name="my-django-app",       # your service name
    sample_rate=0.5,                    # random sample rate (0.0–1.0, capped at 0.3)
    send_error_spans=True,              # always export error spans
    error_tps=5,                        # max 5 error spans per second
    slow_threshold_ms=200,              # always export spans >200ms
    export_timeout=10.0                 # HTTP timeout for exporter
)

os.environ.setdefault("DJANGO_SETTINGS_MODULE", "myproject.settings")
application = get_wsgi_application()  # or get_asgi_application()
Why Use WATCHLOG for Django Monitoring?
Unlike generic monitoring tools, WATCHLOG is built with developer-first integrations. For Django specifically, it combines:
- Server monitoring via Agent (CPU, memory, uptime, networking).
- Custom event tracking for business-critical workflows.
- Full-stack APM with request traces, errors, and database analysis.
This unified approach saves you from juggling multiple tools and dashboards — everything is in one place, making your monitoring simpler, faster, and more actionable.
Call to Action
Ready to take your Django performance monitoring to the next level?
and gain full visibility into your servers, applications, and events — all in one place.