
 Ahmad Ali Bagheri
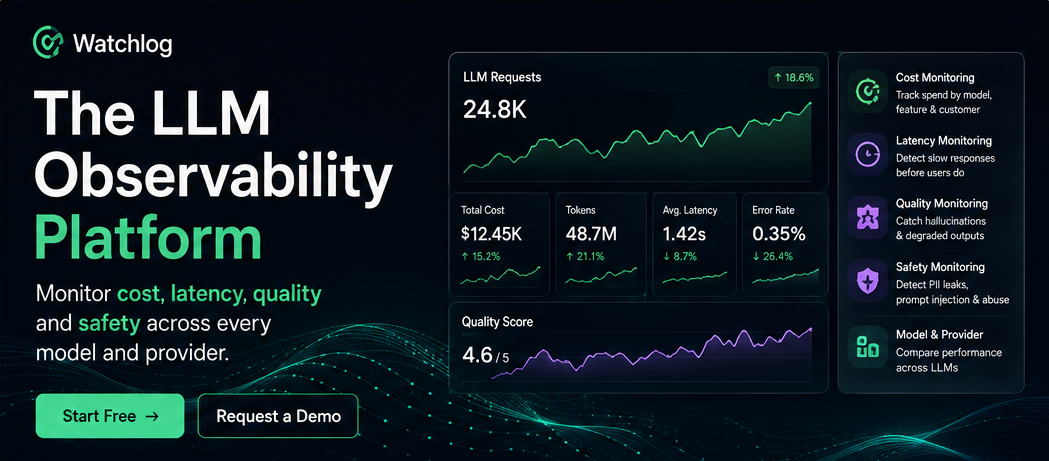
One place to watch cost, latency, quality and safety across every model and provider — connected to the rest of your stack, not sitting in a silo.
Search Intent Answer Block
An LLM observability platform is the monitoring layer for generative-AI applications. It captures what a traditional APM tool can't see — the model, provider, prompt, response, token count, cost and latency of every LLM call — and scores each output for quality and safety issues such as hallucinations, PII leaks and prompt injection. The best platforms connect that LLM telemetry to the rest of your infrastructure, application and log data so you can trace a slow, expensive or unsafe response back to its root cause in one view.
The rest of this guide covers what to monitor, the mistakes teams make, how Watchlog approaches it, and links to a deep-dive article for every sub-topic.
The Problem: LLMs Fail in Ways Your Existing Monitoring Can't See
Traditional observability was built for deterministic systems. A request either succeeds or it doesn't; a query is fast or slow; an error throws a stack trace. LLMs break all of those assumptions.
A generative-AI feature can return a 200 OK in 400ms and still be broken — confidently hallucinated, subtly off-topic, leaking a customer's email address, or manipulated by a prompt-injection string buried in user input. None of that shows up in CPU graphs, HTTP status codes or an APM flame chart. The failure is in the content of the response, not the mechanics of the request.
At the same time, the operational profile is unfamiliar. Latency is dominated by an external provider you don't control and swings with prompt length and model choice. Cost is per-token and non-linear, so a single retry loop or an over-stuffed context window can quietly multiply your bill. And because most teams reach for a separate LLM-specific tool, this telemetry ends up stranded away from the infra, app and log data that would explain why a response was slow or wrong.
That's the category-level pain an LLM observability platform exists to solve: making the invisible parts of a GenAI system — quality, safety, cost and per-call latency — visible, and keeping them in the same place as everything else you already monitor.
Why This Matters for the Business
LLM observability isn't a nice-to-have for AI-native teams; it maps directly to money, trust and risk.
- Margin. AI features are billed per token. Without per-call cost visibility, unit economics are a guess and margin leaks (retry storms, runaway context, wrong-model routing) hide until the invoice lands.
- User trust and retention. A hallucinated or off-topic answer erodes confidence in the product faster than downtime does — and unlike downtime, it's silent. You only learn about it from churn or a support ticket.
- Compliance and safety exposure. PII in a prompt or response, a successful prompt injection, or toxic output isn't just embarrassing — in regulated contexts it's a reportable incident. Detecting it after the fact is far more expensive than catching it in real time.
- Incident MTTR. When an LLM feature degrades, the question is always "is it the model, the provider, our code, or the data?" A platform that correlates LLM telemetry with app and infra data answers that in minutes instead of a war-room afternoon.
The Mistakes Teams Make Across the Category
These recur across every article in this cluster — they're the category's greatest hits, not one narrow symptom:
- Treating LLM latency like ordinary API latency. A p50 that looks fine hides the tail that actually loses users. (Deep dive: Debug Slow AI Responses.)
- No cost attribution. Teams see a total OpenAI bill but can't tie spend to a feature, route or customer — so they can't find the leak. (Deep dive: Track AI API Costs by Feature or Customer.)
- Ignoring quality and safety entirely. Latency and cost get dashboards; hallucinations, PII and prompt injection get nothing until an incident forces the issue.
- Siloed LLM tooling. LLM traces live in one tool, infra and APM in another, logs in a third. Root-cause analysis means tab-switching and guesswork.
- Manual-only instrumentation with no alerting. Spans get captured but nobody is told when hallucination scores spike or cost jumps — the data exists but doesn't do anything.
- Skipping frameworks and agents. LangChain chains and multi-step agents fail between the steps, exactly where un-instrumented code is blind. (Deep dives: Monitor LangChain in Production, AI Agent Monitoring.)
How Watchlog Covers LLM Observability End-to-End
Watchlog treats LLM observability as one layer of full-stack observability rather than a bolt-on tool. Three pieces work together:
GenAI Monitoring captures every model call and scores it in real time. According to Watchlog's product documentation, each call records the input prompts, output responses, latency, tokens, cost, and quality metrics, and ten analysis modules continuously check outputs for hallucination, PII, prompt injection, toxicity, sentiment, similarity drift and more. It works across OpenAI, Anthropic, Google DeepMind, Cohere, Mistral and other providers, with auto-capture for OpenAI and Anthropic and lightweight SDKs for Node.js, Python, PHP, Django, FastAPI and Laravel.
Correlated full-stack context. Because GenAI events flow through the same ingestion pipeline as Watchlog's APM traces, logs, RUM and infrastructure metrics, a slow or failed AI response can be traced through your application code and infrastructure — not just the model call in isolation.
AI Analysis applies AI-assisted root-cause analysis on top, so when an LLM-driven incident fires you get a head start on why, not just that it happened.
[VERIFY] Framework auto-instrumentation (LangChain / LlamaIndex / RAG), agent tool-call and multi-step tracing, percentile (p95/p99) and time-to-first-token latency views, and dedicated cost-per-customer/per-feature dashboards are not documented on the live product page. Custom attributes / user context can be attached to each event, which enables attribution — but confirm the specific dashboard views with the product team before claiming them here.
Capabilities at a Glance
| Capability | What it does | Status |
|---|---|---|
| Per-call capture | Model, provider, prompt, response, latency, tokens, cost per call | ✅ Live (product page) |
| Hallucination & quality drift | Scores LLM/semantic/final output quality over time | ✅ Live |
| PII detection | Classifies PII across prompts and responses | ✅ Live |
| Prompt-injection scoring | Risk scoring + guardrail coverage for malicious inputs | ✅ Live |
| Toxicity / sentiment / topic / similarity | Six further scoring modules for safety and drift | ✅ Live |
| Multi-provider support | OpenAI, Anthropic, Google DeepMind, Cohere, Mistral, Groq, Bedrock | ✅ Live |
| Alerting | Thresholds configurable per model/provider/project → Slack, Telegram, webhooks | ✅ Live |
| SDKs | Node.js, Python, PHP, Django, FastAPI, Laravel; auto-capture for OpenAI & Anthropic | ✅ Live |
| Unified pipeline | GenAI events correlate with APM, logs, RUM, infra | ✅ Live |
| Span-level AI Traces client libraries | Wrap LLM calls to record spans (model/provider/tokens/cost) | ✅ Live — [VERIFY exact package names] |
| Framework auto-instrumentation (LangChain/RAG) | — | [VERIFY] not documented |
| Agent tool-call / multi-step tracing | — | [VERIFY] not documented |
| Percentile / TTFT latency views | — | [VERIFY] not documented |
| Cost-per-customer / per-feature dashboards | Cost captured; attribution via custom attributes | [VERIFY] dedicated view not documented |
Explore by Topic (the core of this pillar)
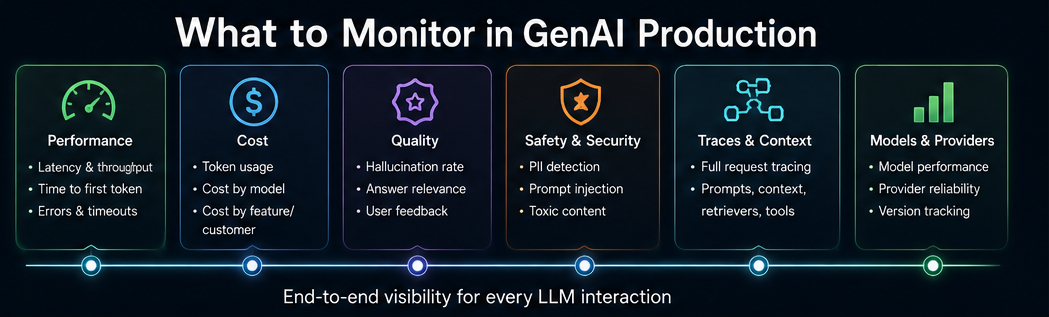
Every deep-dive in the LLM cluster, grouped by the job you came here to do. Pick your problem.
Link-check gate: each link below must return 200 and resolve to the correct published article before this pillar ships (v2 Internal Linking rule 4 + Pillar link-check). Currently [VERIFY LIVE].
Performance & reliability
- Debug slow AI responses before users notice — where LLM latency actually goes, and how to catch a slow response before a user does. [VERIFY LIVE]
- Build an OpenAI usage dashboard with OpenTelemetry — a copy-paste setup for token, latency and cost visibility using open standards. [VERIFY LIVE]
Cost & unit economics
- Track AI API costs by feature or customer — a framework for attributing LLM spend so you can find margin leaks before the bill scales. [VERIFY LIVE]
Frameworks & agents
- How to monitor LangChain in production — what to instrument in a LangChain app and where chains fail silently. [VERIFY LIVE]
- AI agent monitoring: conversations, tool calls and costs — observing multi-step agents that call tools and rack up cost between the steps. [VERIFY LIVE]
Choosing a tool
- Langfuse alternative for AI-native startups — how a unified full-stack platform compares to an LLM-only engineering tool. [VERIFY LIVE]
Who Lands Here — and Why
- The AI-native startup shipping its first LLM feature. Needs quality and cost visibility from day one, without standing up a monitoring team.
- The platform / SRE team adding an LLM to an existing product. Wants LLM telemetry in the same tool as its infra and APM, not a separate silo.
- The team with a bill that's growing faster than usage. Needs per-call cost data to find the leak.
- The team facing a safety or compliance requirement. Needs real-time PII, prompt-injection and toxicity detection with an audit trail.
How Watchlog Is Different
vs. do-it-yourself (OpenTelemetry + Grafana). Open standards get you raw traces, but you still build the GenAI scoring, the quality/safety detection, the alerting and the dashboards — and maintain them. Watchlog ships that layer. (If DIY is your starting point, the OpenTelemetry dashboard article above shows the standards-based path and where a platform takes over.)
vs. enterprise incumbents (Datadog, Dynatrace, New Relic LLM observability). The big platforms have capable LLM modules, but they're priced and packaged for large orgs and add another expensive line item on top of an already-large observability bill. Watchlog targets small and mid-size teams with published, usage-based pricing.
vs. LLM-only point tools (Langfuse, Helicone, etc.). These are strong at LLM-engineering workflows but live apart from your infrastructure and application monitoring. When an AI response is slow, you still don't know if it's the model or your own service. Watchlog's advantage is correlation: LLM telemetry in the same pipeline as everything else.
Pricing / Affordability
Watchlog publishes GenAI Monitoring pricing rather than hiding it behind a sales call. As listed on the product page (verified 28 Jul 2026):
| Plan | Price | Included |
|---|---|---|
| Startup (Bronze) | $49/mo | Up to 100K model calls/mo · hallucination & PII detection · email & Slack alerts · 3 dashboards · 5 team members |
| Growth (Silver) | $199/mo | Up to 1M model calls/mo · prompt-injection & toxicity alerts · similarity & sentiment scoring · 10 dashboards · 15 members · webhook & Telegram |
| Enterprise (Gold) | Custom | Unlimited requests · dedicated infra & SSO · 24/7 support · data residency & retention control · custom scoring & SLA |
Pricing is usage-based — calculated on number of model calls and stored logs, with no per-token fees.
Assumption disclosure (v2 Trust Signals): these figures are the published list prices for the GenAI Monitoring module as of 28 Jul 2026 and depend on your call volume and log retention. Confirm current numbers and whether a free trial exists for the GenAI module before publishing — pricing pages change. Re-verify monthly.
Objection Handling
"We already have Datadog / Dynatrace." You may already have LLM telemetry — the question is what you're paying for it and whether it's worth a second bill. This pillar's job is to show the trade-off, not to claim Watchlog wins every scenario.
"We use Langfuse for our LLM work." Langfuse is good at LLM-engineering workflows. The gap it doesn't close is correlation with your infra, APM and logs — which is the difference between "the model was slow" and "our retrieval step timed out."
"Setup sounds like a project." Instrumentation is add-your-API-key-and-wrap-your-LLM-calls, with auto-capture for OpenAI and Anthropic and SDKs for six runtimes.
"Our AI feature is small." The $49 Startup plan covers up to 100K model calls a month — cost and quality problems are cheaper to catch early than to unwind later.
"Is our data safe?" Metrics and logs are encrypted at rest and in transit, with SSO and RBAC built in, and PII can be anonymized before storage.
FAQ
What is an LLM observability platform?
The monitoring layer for generative-AI apps. It captures the model, provider, prompt, response, tokens, cost and latency of every LLM call and scores outputs for quality and safety issues, ideally alongside your existing infra and app monitoring.
What should I actually monitor for an LLM feature?
Four things: cost per call, latency (including the tail), output quality (hallucination, relevance, drift), and safety (PII, prompt injection, toxicity).
How is it different from APM?
APM watches the mechanics of a request — status, duration, errors. LLM observability watches the content and economics of the response, which is where GenAI actually fails.
Does Watchlog detect hallucinations?
Yes — hallucination and quality-drift scoring is one of ten GenAI analysis modules, alongside PII, prompt-injection and toxicity detection.
How much does it cost?
Published plans start at $49/month for up to 100K model calls, scaling to a custom enterprise tier; billing is usage-based on model calls and stored logs.
How long does setup take?
Add your API key, install an SDK, and wrap your LLM calls; OpenAI and Anthropic calls can be auto-captured.
Trust Signals
- Author: [Add author name + role] — link to author bio (bare name is not sufficient per v2; bio must include role at Watchlog + one-sentence expertise claim).
- Technical reviewer: Reviewer: pending — confirm before publishing (this page makes specific technical and pricing claims, so a named reviewer is required by v2 Trust Signals).
- Last updated: [Add date] · Pricing re-verification cadence: monthly (this page states specific prices).
- Sourcing transparency: every product and pricing claim traces to Watchlog's live GenAI Monitoring product page and docs (see Sources). No competitor pricing is stated numerically on this page; if any is added, date it inline per v2 External Linking rule 6.
- Product proof, no fabrication: use the real GenAI Monitoring dashboard demo and module screenshots from the product page as proof. No invented customer logos, testimonials or usage statistics.
- Assumption disclosure: the pricing figures in Section 13 depend on call volume and retention and are dated; the illustrative scenarios in Sections 5–7 are labelled as common patterns, not case studies.
Sources
- Watchlog — Generative AI Monitoring product page.
https://watchlog.io/products/gen-ai-monitoring(accessed 28 Jul 2026) - Watchlog — GenAI Monitoring documentation.
https://docs.watchlog.io/get-started/Gen-AI-Monitoring.html(accessed 28 Jul 2026)
Cross-Cluster Pointer
If your driver is cost and consolidation across your whole stack rather than the LLM layer specifically, start with our guide to an affordable, full-stack observability platform [VERIFY LIVE] — the cost/observability cluster this pillar sits next to. (One sentence only — this pillar does not distribute equity into a cluster it doesn't own.)
Technical SEO Checklist (pre-publish)
Core Web Vitals — must pass all three:
- [ ] LCP < 2.5s
- [ ] INP < 200ms
- [ ] CLS < 0.1
Structured data:
- [ ]
Articleschema on this pillar - [ ]
BreadcrumbListschema reflecting real path: Home → Blog → LLM Observability → (this page) - [ ]
FAQPageschema (Section 15 FAQ is visibly rendered — required condition met) - [ ]
Product/Offerschema for the GenAI pricing stated in Section 13 - [ ]
Organizationschema (site-wide, not per-page)
On-page:
- [ ] One H1, matching the page title
- [ ] Logical H2/H3 hierarchy, no skipped levels
- [ ] SEO title < 60 chars · meta description 150–160 chars
- [ ] Clean, keyword-matching slug (
/llm-observability-platform) - [ ] Canonical tag present · indexable (no accidental
noindex) - [ ] All images: descriptive alt text, compressed < 150KB, explicit width/height (CLS)
- [ ] Mobile-first layout verified (not just "responsive")
Pillar-specific (v2):
- [ ] Table of contents anchored to every H2 on the page
- [ ] Pre-publish link-check of every supporting-article and product URL — each returns 200 and resolves to the correct destination (this is the step that catches the empty-href and wrong-slug failures from the July 2026 audit)
- [ ] Reciprocal back-links added to all six cluster articles in the same sprint (v2 rule 5 + 6)
- [ ]
?ref=params present on every link crossing towatchlog.io/app.watchlog.io
CRO Tracking Plan
Pillar-specific metric — cluster_link_click, tracked per destination (separate from generic internal_link_click), because the distribution across Explore-by-Topic tells you which sub-topic to expand next:
cluster_link_click_debug_slow_aicluster_link_click_ai_cost_attributioncluster_link_click_openai_otel_dashboardcluster_link_click_langchaincluster_link_click_ai_agent_monitoringcluster_link_click_langfuse_alternative
Per-CTA events (never one aggregate "CTA click"):
cta_start_free_clickcta_request_demo_clickcta_pricing_click
Three-tier CTA placement (v2 CTA Standard, pillar variant):
- Tier 1 (soft): the Explore-by-Topic section itself acts as the soft-CTA layer.
- Tier 2 (primary): distinct Start Free button after Section 8 ("How Watchlog Covers LLM Observability").
- Tier 3 (closing): Start Free + View Pricing at the end — different copy from Tier 2, no duplicate labels.
Also measure: organic impressions/clicks for "LLM observability platform" + secondaries; cluster-wide ranking lift (the pillar's real success metric); scroll depth to Explore-by-Topic; FAQ opens; signups attributed to this URL.
Pre-publish checklist (must clear before going live)
- [ ] Add author (with linked bio), named technical reviewer, and last-updated date
- [ ] Confirm/remove every [VERIFY] capability with the product team
- [ ] Re-verify GenAI pricing and free-trial availability against the live pricing page
- [ ] Confirm the AI Analysis product slug and the AI Traces SDK package names
- [ ] Link-check all six supporting articles + all product URLs (200 + correct destination)
- [ ] Add reciprocal back-links from all six cluster articles
- [ ] Remove this internal note and the grounding banner