
 Ahmad Ali Bagheri
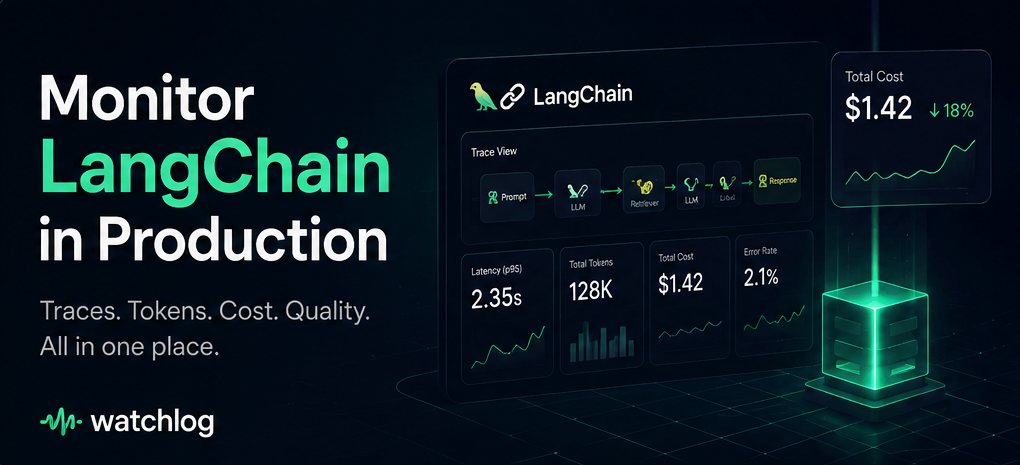
Short answer: To monitor a LangChain app in production, instrument it at three layers — (1) the request/trace layer (end-to-end latency, errors, and a span for every chain, LLM call, retriever, and tool), (2) the LLM layer (token usage, cost, and output quality per call), and (3) the infrastructure layer (the service and host actually running the app). The cleanest way to capture the first two is LangChain's callback system exported over OpenTelemetry (OTLP), which you can send to any OTLP-compatible backend. This guide covers what to measure, the mistakes that bite teams in production, and how to wire it up.
Why LangChain is hard to monitor
A traditional web request is mostly linear: it comes in, hits your code and database, and returns. A LangChain request is not. A single user prompt can fan out into a chain of prompt templates, one or more model calls, a retriever hitting a vector store, and several tool invocations — and with agents (or LangGraph), the path itself changes depending on the model's output. When a response is slow, wrong, or expensive, "the app was slow" tells you nothing. You need to know which step was responsible: the retriever that returned irrelevant chunks, the prompt that dropped context, or the model call that stalled.
The abstraction that makes LangChain fast to build with is the same abstraction that hides behaviour you need to see in production. Standard APM catches the HTTP request and the exception, but it's blind to the LLM-specific failure modes — token blow-ups, silent quality drift, a tool that quietly returns garbage — that actually determine whether your feature works.
The business impact of flying blind
LLM features fail in ways that don't throw a 500. Three stakes matter:
- Cost. Every model call is metered. One badly-tuned agent loop, a prompt that balloons context, or a retrieval step that stuffs too many documents can multiply your bill overnight — and an aggregate invoice won't tell you which feature did it.
- Reliability. Rate limits, provider timeouts, and cascading retries across chain steps produce latency spikes that are invisible if you only watch the top-level endpoint.
- Trust. Hallucinations, prompt-injection, and PII leaking into responses are quality/safety failures. They pass every HTTP health check and still damage users' trust in the product.
Common mistakes teams make
- Only monitoring infrastructure. CPU and memory are green while the LLM quietly costs 10× and answers get worse. Infra metrics can't see the model.
- Tracking cost only in aggregate. A single monthly number can't tell you which chain, feature, or user segment is expensive. Break token spend down by feature and workflow.
- No step-level tracing. Without a span per chain step, retriever, and tool call, debugging a bad answer is guesswork.
- Logging full prompts and responses with PII. Traces that carry raw user data out of your environment are a compliance risk. Redact at the runtime layer before telemetry leaves the box.
- No quality signal at all. Latency and errors say nothing about whether the answer was correct. You need evaluation/quality signals alongside the performance metrics.
- Retrofitting observability after an incident. It is far harder to add instrumentation after something breaks than to build it in on day one.
What to actually monitor
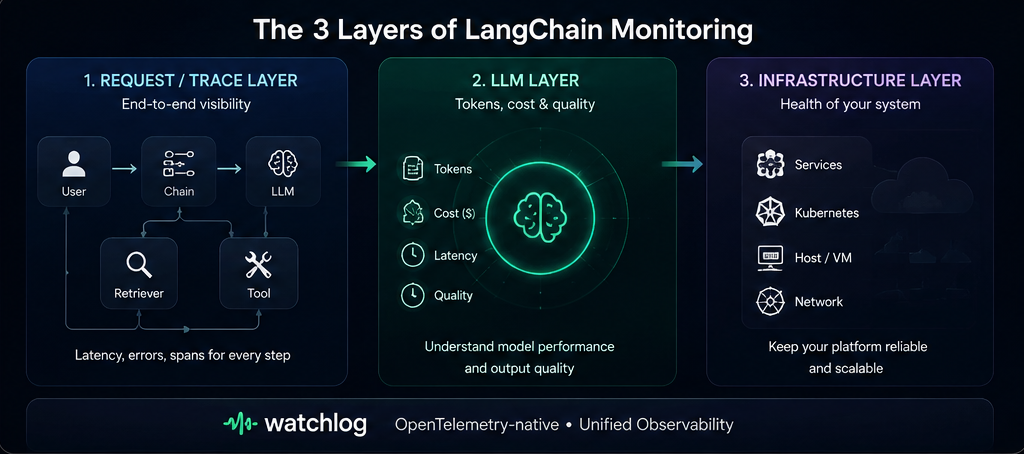
Group your signals into the three layers:
Trace / performance layer
- End-to-end latency (avg, p95, max) per endpoint, plus per-step latency for each chain, LLM call, retriever, and tool.
- Error and retry rates, broken down by provider error, rate limit, and timeout.
- Throughput and concurrency.
LLM layer
- Token usage (prompt + completion) and derived cost per call, per chain, per feature, and per user segment.
- Model / version in use, so you can spot drift after a model swap.
- Output quality and safety signals: hallucination scoring, prompt-injection attempts, PII leakage, and quality drift over time.
- For RAG: retrieval relevance and cache hit rate.
Infrastructure layer
- The service and host running the app: CPU, memory, and container/pod health — especially relevant if you deploy on Kubernetes monitoring.
How to instrument LangChain
LangChain exposes a clean integration point for observability: its callback system. A callback handler receives lifecycle events for chains, LLM calls, retrievers, and tools — the natural place to open and close spans. This pattern works across LCEL chains, legacy chains, and agent executors. [Source 1]
You have three practical routes, and they compose:
- OpenTelemetry via a callback handler. Implement (or adopt) a callback handler that emits an OTLP span per component, plus custom metrics for aggregates like token count and cost. This is vendor-neutral — you emit spans once and can route them anywhere.
- OpenInference auto-instrumentation. OpenInference is a community standard, built on OpenTelemetry, that ships pre-built instrumentation for LangChain so you can trace with minimal manual wiring. [Source 3]
- LangSmith with OTLP fanout. If you already use LangChain's own LangSmith tracing, you can enable OpenTelemetry export (
LANGSMITH_OTEL_ENABLED=true) and use an OpenTelemetry Collector to fan the same spans out to LangSmith and other backends at once. [Source 2]
A production-grade setup adds an OpenTelemetry Collector in front of your backends to handle batching, sampling (tail-based sampling keeps the interesting traces), and PII scrubbing before data leaves your environment. [Source 4]
The key point: because these routes all speak OTLP, your telemetry is portable. You are not locked into one dashboard.
How Watchlog helps
Watchlog is a full-stack observability platform, and its APM is OTLP-native — if you're already exporting OpenTelemetry data, you point your OTLP exporter at Watchlog and the traces show up, no rebuild required. That means the LangChain spans from any of the three routes above land in the same place as your service, database, and host metrics — so a slow answer and the infrastructure it ran on sit in one trace. [confirm w/ docs: exact OTLP endpoint + LangChain snippet for the article's copy-paste block]
On top of that, Watchlog Gen AI Monitoring is built for the LLM layer specifically: it captures model requests and responses and surfaces hallucination scoring, prompt-injection and PII-leak detection, and quality drift across providers including OpenAI, Anthropic, Cohere, Mistral, and Amazon Bedrock — with alerting to Slack, Telegram, or webhooks. Combined with OpenTelemetry-native APM for the trace and infra layers, that covers all three layers a LangChain app needs.
[Tier 2 CTA — button/offset block]
Start monitoring your LangChain app free →https://app.watchlog.io/signup?ref=blog-langchain[confirm URL]
No credit card required. Point your existing OTLP exporter at Watchlog and see your first traces in minutes.
Who this is for (use cases)
- RAG apps where retrieval quality and cost per query decide whether the feature is viable.
- Agent / LangGraph workflows whose non-linear paths make step-level tracing essential.
- Platform teams consolidating LLM observability into the same stack as their existing infra and APM, instead of running a separate silo.
How Watchlog is different
- vs. rolling your own (
print(), ad-hoc logs): you skip building span trees, cost math, and PII scrubbing by hand, and you get quality/safety signals you'd otherwise never instrument. - vs. an LLM-only tracing tool: LangChain traces alone don't include the host, container, and database. Watchlog puts LLM behaviour and the infrastructure it runs on in one platform, so you're not correlating across two products during an incident.
[reviewer: confirm framing is fair to LangSmith, which is complementary via OTLP fanout, not strictly a competitor] - vs. enterprise incumbents (Datadog, New Relic): comparable coverage without the price curve that those tools are known to hit at scale.
[confirm w/ docs / see comparison content for exact positioning]
Pricing
Watchlog offers a Free tier to get started (no credit card), a Pro tier for production usage with usage-based add-ons, and Enterprise for a dedicated, single-tenant instance with SLAs and branding. Because LLM telemetry volume depends on your model, token throughput, and traffic, your actual cost will vary — check current tiers and the usage calculator on the Watchlog pricing page. [Pricing re-verify: monthly.]
Objection handling
- "Won't instrumentation slow my app down?" A callback handler runs in-process; the recommended pattern adds negligible overhead on the critical path, and a Collector moves batching/export off it. [Source 4]
- "I already use LangSmith." Keep it — enable OTLP fanout and send the same spans to Watchlog too, so LLM traces sit next to infra. [Source 2]
- "We can't send prompts off-box for compliance." Redact PII at the runtime/Collector layer before export; don't ship raw user data. [Source 4]
FAQ
What metrics matter most for a LangChain app in production?
Per-step latency, token usage and cost broken down by feature, error/retry rates by cause, and at least one quality/safety signal (hallucination, PII, injection). Infra metrics on the host complete the picture.
Do I need LangSmith to monitor LangChain?
No. LangSmith is one option; you can instrument via the callback system with OpenTelemetry or OpenInference and export OTLP to any compatible backend. LangSmith can also fan out over OTLP if you already use it. [Source 1, 2, 3]
How do I track LLM cost in LangChain?
Capture prompt and completion tokens per call in your callback handler, convert to cost, and tag each span with the feature/workflow/user so you can break spend down instead of watching one aggregate bill. [Source 5]
Can I monitor a LangGraph agent the same way?
Yes — the callback/OTLP pattern covers agent executors and LangGraph nodes; step-level spans matter even more for non-linear agent paths.
How do I keep PII out of my traces?
Redact at the runtime layer and/or in the OpenTelemetry Collector before telemetry leaves your environment. [Source 4]
[Tier 3 CTA — closing, BOFU: two CTAs, distinct copy]
Ship LangChain to production with eyes open. Send your OpenTelemetry data to Watchlog and watch cost, latency, and quality in one place.
[Button A] Start free →https://app.watchlog.io/signup?ref=blog-langchain· [Button B] Compare pricing →https://watchlog.io/pricing?ref=blog-langchain
Sources
(External links: primary sources, dated, target="_blank" rel="noopener"; competitor links rel="nofollow". Re-verify dates on each update.)
- LangChain — "Trace with OpenTelemetry" docs.
https://docs.langchain.com/langsmith/trace-with-opentelemetry— accessed 2026-07-28. (Primary source; no nofollow.) - LangChain / LangSmith — OTLP fanout (
LANGSMITH_OTEL_ENABLED) via OpenTelemetry Collector, same doc as above — accessed 2026-07-28. - OpenInference community instrumentation for LangChain (built on OpenTelemetry).
[add canonical OpenInference/OpenTelemetry primary URL before publish]— accessed 2026-07-28. - Production instrumentation practices (in-process handler overhead, Collector, tail-based sampling, PII scrubbing).
[cite the specific primary/vendor-doc source you use; the practices above are corroborated across LangChain docs + OpenTelemetry Collector docs]— accessed 2026-07-28. - Per-feature / per-trace LLM cost breakdown as a production best practice.
[cite chosen source]— accessed 2026-07-28.
Note for editor: Sources 3–5 currently point to secondary write-ups from the research pass; replace each with the closest primary source (LangChain docs, OpenTelemetry.io, OpenInference repo) before publishing, per External Linking rule 2.
Technical SEO Checklist (revised Section 16)
Core Web Vitals — must pass before publish
- [ ] LCP < 2.5s
- [ ] INP < 200ms
- [ ] CLS < 0.1
Structured data
- [ ]
Articleschema - [ ]
FAQPageschema (FAQ is visibly rendered on the page ✔) - [ ]
BreadcrumbListschema: Home → Blog → LLM Observability → this article - [ ]
Organizationschema (site-wide — verify present, not per-page) - [ ]
Product/Offerschema not required here (no specific price stated on-page; pricing lives on/pricing)
On-page
- [ ] Single H1 matching page title
- [ ] Logical H2/H3 hierarchy, no skipped levels
- [ ] SEO title < 60 chars (✔ 51)
- [ ] Meta description 150–160 (✔ 154)
- [ ] Clean slug
/how-to-monitor-langchain-in-production - [ ] Canonical tag set
- [ ] Indexable (no accidental
noindex) - [ ] All images: descriptive alt text, < 150KB, explicit width/height
- [ ] Mobile-first layout verified (not just responsive)
- [ ] Every internal + external link returns 200 and hits the correct destination — re-run immediately before publish (
app.watchlog.io/signupslug still needs confirmation)
CRO Tracking Plan (per-CTA, not aggregate)
cta_start_free_click(Tier 2 button + Tier 3 Button A — track separately by placement)cta_pricing_click(Tier 3 Button B + in-body pricing link)internal_link_clickon/products/apm,/products/gen-ai-monitoring,/products/kubernetes,/docs- Cross-domain links carry
?ref=blog-langchainso blog→app/marketing conversions are attributable - Scroll-depth to the "How Watchlog helps" section (the Tier 2 conversion moment)
Pre-publish blockers (must clear)
- Assign and record a technical reviewer; confirm the Watchlog capability claims and the vs-incumbent/vs-LangSmith framing.
- Confirm
app.watchlog.io/signupURL/slug (or the correct signup path). - Replace Sources 3–5 with primary URLs and confirm all dates.
- Add the author bio link and last-updated date.
- If/when an LLM Observability pillar exists, add the pillar link and back-link from the pillar within the same sprint.
- Add a real product screenshot (LangChain trace in Watchlog) with alt text — no placeholder proof.