How Server Monitoring Helps Reduce Cloud Costs and Optimize Infrastructure

Cut waste. Scale smarter. Save big with the power of proactive monitoring.
raining Your Server Budget?
In the age of cloud-native apps and microservices, it’s easy for server costs to spiral out of control. Between idle instances, over-provisioned resources, and unmonitored spikes, your infrastructure might be silently draining your budget.
That’s where server monitoring makes all the difference.
One of the most effective ways monitoring reduces server costs is by identifying resources that are underused or overprovisioned.
Monitoring helps identify infrastructure and save costs.
This means you can scale down unused instances, eliminate waste, and even schedule shutdowns during off-peak hours — all without compromising performance.
💡 What’s Draining Your Server Budget?
By using a real-time monitoring platform like Watchlog, you gain the visibility needed to make smarter infrastructure decisions — reducing cloud costs without compromising on performance or reliability.
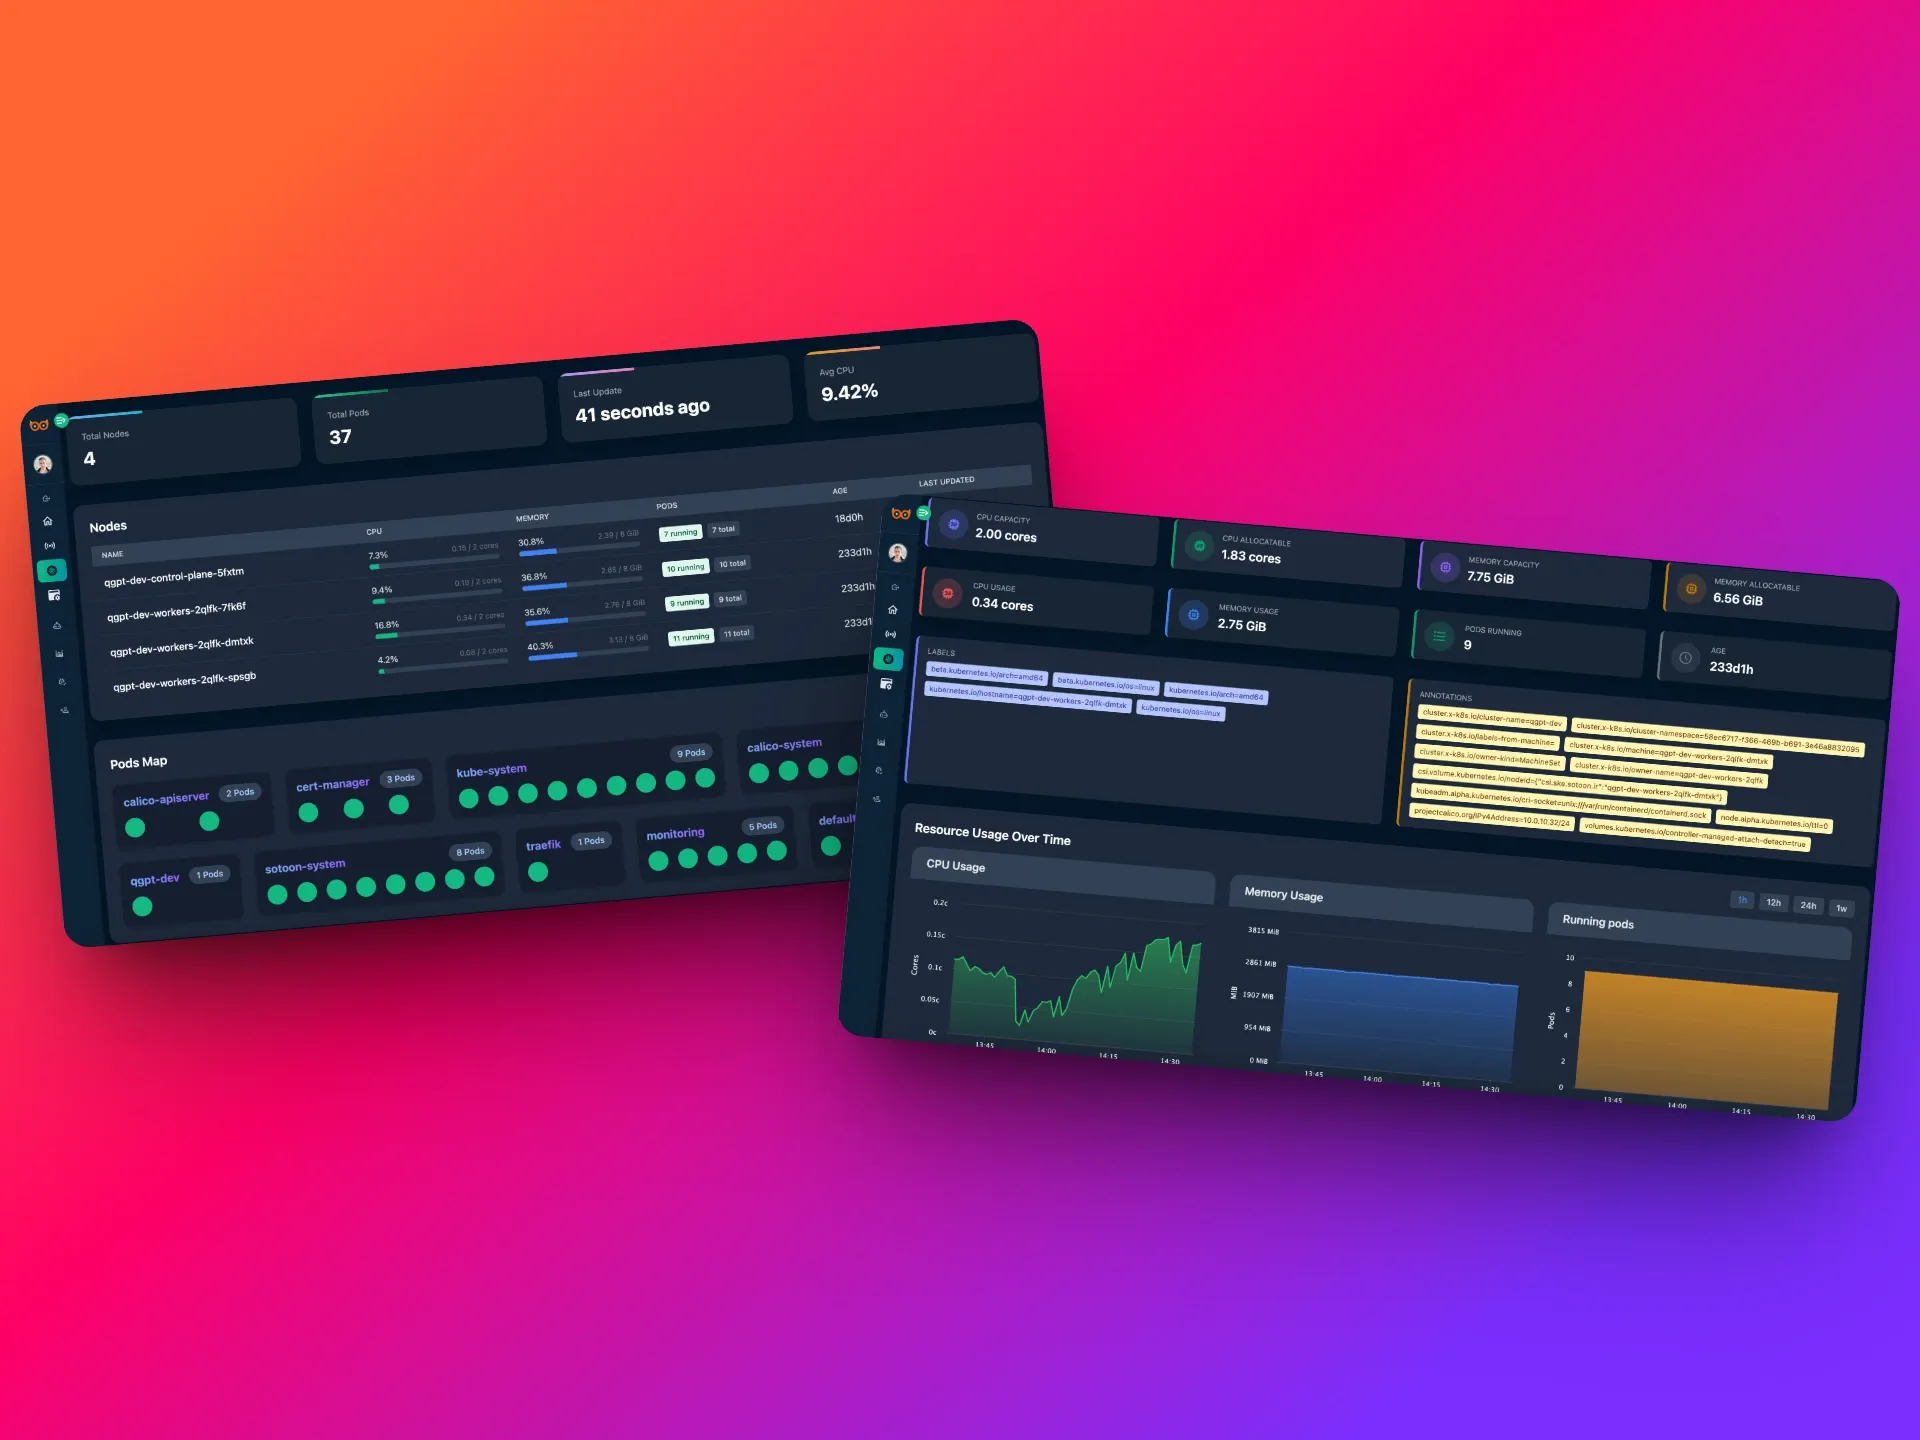
🔍 1. Discover Idle or Underutilized Resources
One of the most common cost leaks is running servers that do… nothing. With continuous tracking of CPU, memory, and network activity, you can easily identify underutilized VMs, containers, or services and scale them down or shut them off.
✅ Watchlog Insight: Sort your infrastructure by average CPU or memory usage to pinpoint low-efficiency nodes instantly.
📈 2. Avoid Expensive Spikes in Usage
Sudden load spikes — from unexpected traffic or inefficient code — can lead to performance issues and surprise billing. Real-time monitoring helps you catch anomalies early so you can act fast.
🛠️ Example: A misconfigured cron job loops every 5 seconds, consuming 100% CPU for hours. Without alerts, you’ll find out only after your invoice grows.
⚙️ 3. Optimize Auto-Scaling Strategies
Auto-scaling is powerful — but only when it’s data-driven. Monitoring historical usage trends helps you define smarter scaling thresholds, avoid overreaction to short bursts, and reduce unnecessary scale-ups.
📊 Watchlog Dashboard: Visualize resource usage trends by time of day or day of week to refine your auto-scaling policies.
🧱 4. Right-Size Your Infrastructure
Instead of over-provisioning "just in case", monitoring lets you confidently right-size. Use real usage data to downgrade instance types or reduce container resource limits while maintaining performance.
👨💻 5. Empower DevOps with Real-Time Feedback
Monitoring isn't just for sysadmins — it's a DevOps best practice. Developers can observe the impact of code deployments on server load, latency, and resource consumption. This leads to leaner, more cost-efficient applications.
👀 Pro Tip: Integrate Watchlog directly into your deployment pipeline to measure impact with every release.
🧠 Common Server Cost Traps — and How Monitoring Prevents Them
One of the biggest challenges in modern infrastructure is invisible cost creep — small inefficiencies that slowly drain your budget without raising alarms. Without proper monitoring, these cost traps go unnoticed until your cloud bill spikes.
Here are a few real-world examples where server monitoring tools like Watchlog can make a measurable difference:
1. Over-Provisioned Resources
Many teams allocate more CPU, memory, or disk than needed — "just in case." While this may seem safe, it results in paying for unused capacity month after month.
✅ With monitoring, you get real-time visibility into actual resource usage and can scale down confidently.
2. Idle Services and Forgotten Instances
It's surprisingly common to leave development servers, background jobs, or testing environments running — consuming resources without adding value.
✅ Watchlog can help you identify low-traffic or inactive instances, so you can shut them down and cut unnecessary cloud costs.
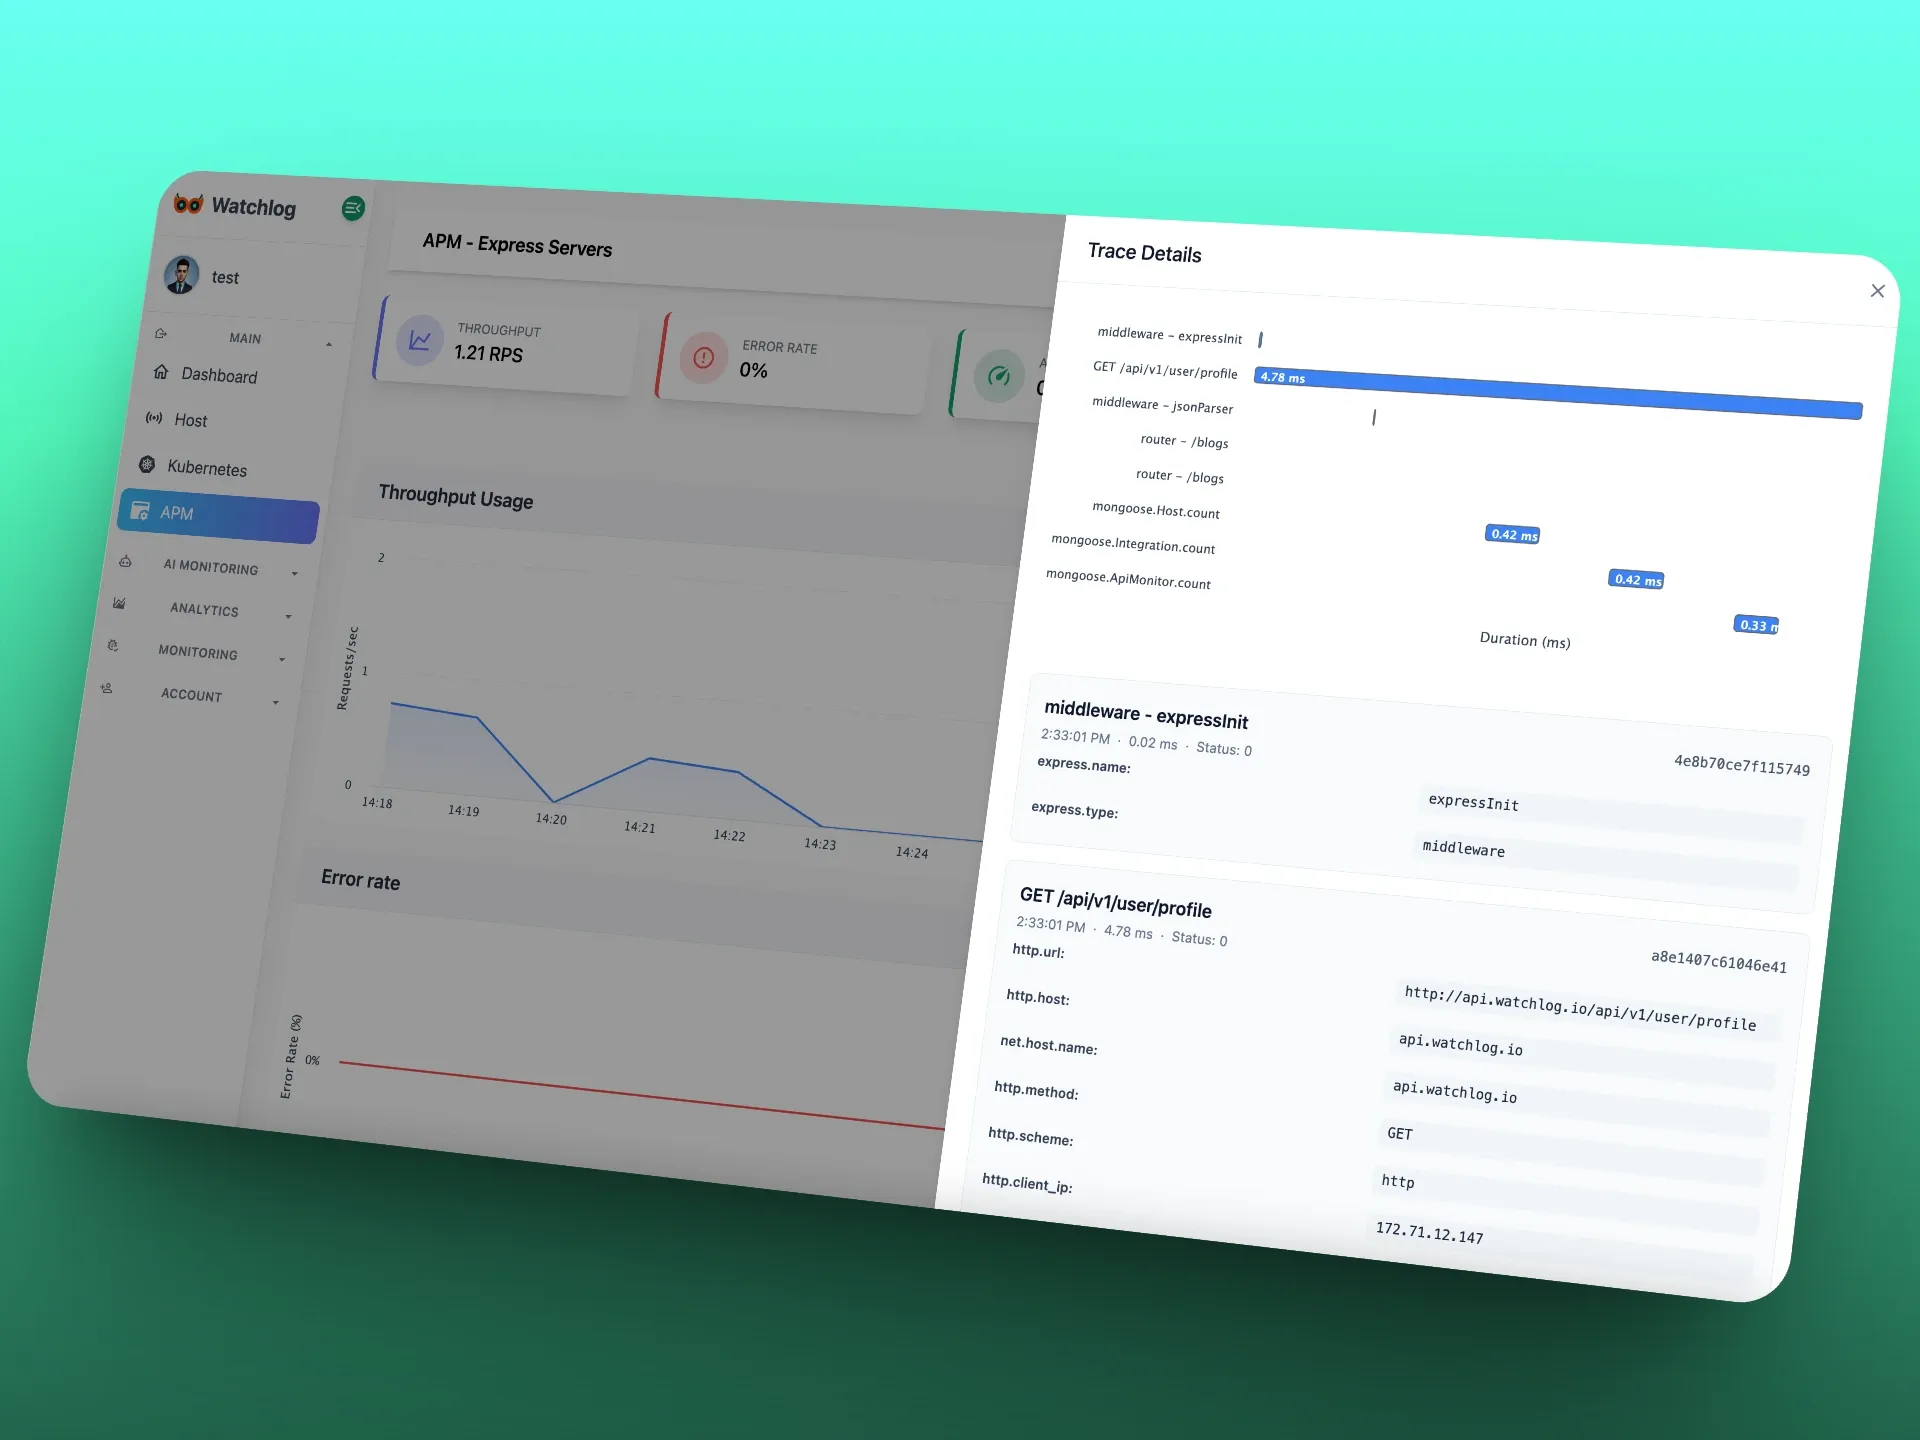
3. Unoptimized APIs and Queries
High API latency or inefficient database queries can spike server load and lead to autoscaling, which means higher bills.
✅ By tracking request duration, error rates, and query performance, you’ll be able to detect and resolve bottlenecks early.
4. Traffic Spikes Without Alerting
Sudden traffic increases can overload servers, trigger autoscaling, and even cause downtime — all of which cost you money.
✅ With Watchlog’s intelligent alerting, you’re notified the moment metrics go beyond safe thresholds — keeping performance stable and costs under control.
💡 Pro Tip:
Set custom alerts for resource thresholds, API error spikes, and usage anomalies — this helps you act before small issues become expensive ones.
🚀 Introducing Watchlog: Your Cost-Efficient Monitoring Solution
Watchlog is a modern, developer-friendly monitoring platform that puts performance, usability, and clarity first. Whether you’re managing a cloud cluster or a single VPS, Watchlog makes it simple to:
- Track live and historical server performance
- Set intelligent alerts for usage spikes
- Analyze trends to optimize resource allocation
- Control costs without sacrificing visibility
No bloat, no noise — just clean, actionable insights.
Start monitoring smarter with Watchlog — for free.