 Ahmad Ali Bagheri
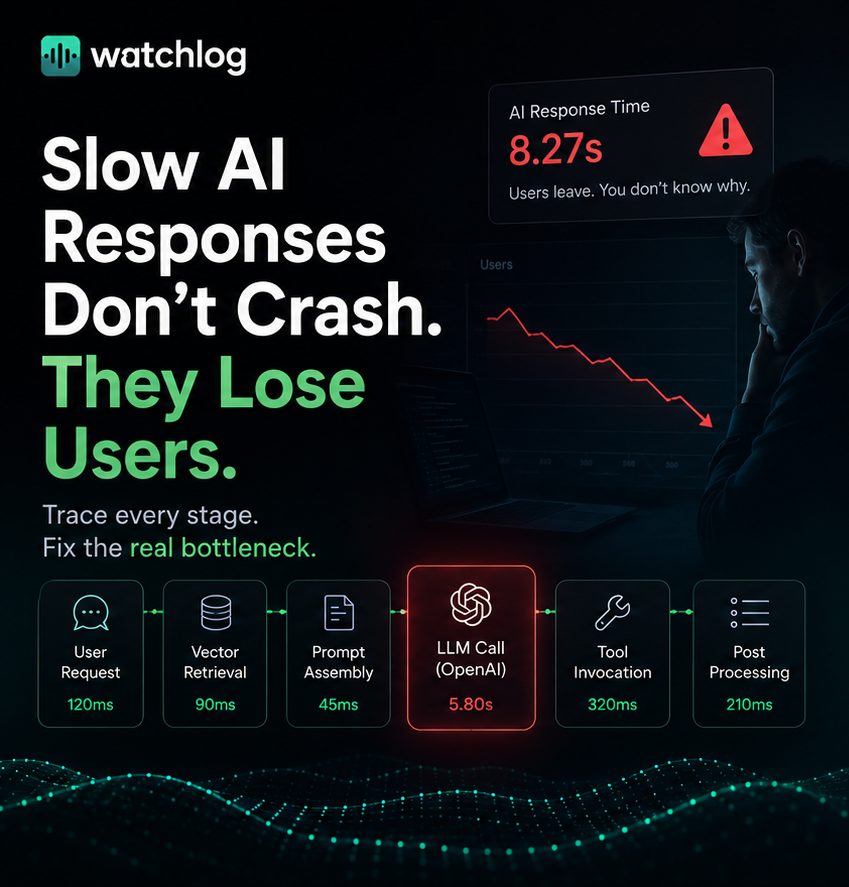
Slow AI responses don't crash. They just quietly lose you users.
A 500 error is loud. Your logs light up, someone gets paged, and you fix it. A slow AI response is the opposite: nothing breaks, no alert fires, and the user just waits. Then they wait a little longer. Then they stop coming back — and you never see a stack trace explaining why.
For AI features this is the more dangerous failure mode, because "slow" is the default state of an LLM call. A single request routinely fans out into retrieval, prompt assembly, one or more model calls, tool invocations, and post-processing. When the whole thing takes eight seconds instead of two, the hard question isn't whether it's slow — it's which stage ate the time. Without per-stage timing, every engineer on the team has a different guess, and the usual "fix" is to blame the model and move on.
The good news: this is a solved problem if you instrument the request properly. You don't need an enterprise observability contract to see where an AI request spends its time. You need a trace around each stage — and a place to send it. (If you already run app-level tracing, Watchlog APM and distributed traces cover the non-AI side of the same request; the SDK below adds the AI-specific spans.)
Why AI latency is uniquely hard to pin down
Three things make LLM latency harder to debug than ordinary API latency:
- The time is spread across stages you don't control equally. Retrieval might be your Postgres/vector store, the model call is a third-party provider, and parsing is your code. A single "response time" number hides all of it.
- It's variable by design. The same prompt can take 1.2s or 6s depending on output length, provider load, and whether you're streaming. Averages lie; you need to see the shape of the distribution, not one number.
[VERIFY]— percentile/distribution views for AI traces are not documented in the AI Traces SDK docs; if you want p95/p99 on AI spans specifically, confirm with the product team before promising it here. - "Perceived" slowness ≠ total time. For a streaming UI, what users feel is time to first token, not total generation time.
[VERIFY]— time-to-first-token is a real, important metric, but it is not a documented first-class field in the AI Traces SDK; you'd capture it as a manually recorded span/marker. Don't imply Watchlog surfaces TTFT out of the box unless product confirms it.
The throughline: you can't fix what you can't attribute. So the first job is attribution — turning one opaque "it's slow" into a per-stage breakdown.
The method: wrap every stage of the AI request in a span
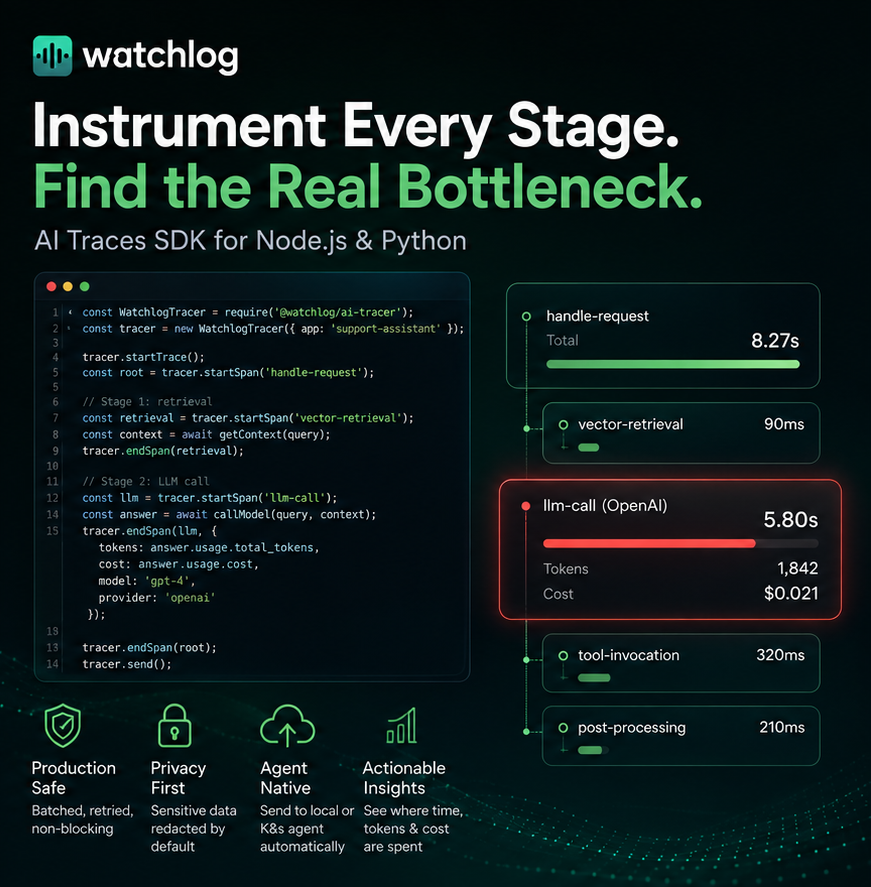
A trace is one end-to-end AI request. A span is one stage inside it. Because every span has a start and an end, instrumenting each stage gives you its duration for free — which is exactly what tells you whether the model, your retrieval, or your own pre/post-processing is the bottleneck.
Watchlog ships a small AI Traces SDK for this — @watchlog/ai-tracer for Node and python-ai-tracer for Python. It's deliberately manual: you decide what a stage is and wrap it. Here's the shape of a single instrumented request in Node:
const WatchlogTracer = require('@watchlog/ai-tracer');
const tracer = new WatchlogTracer({ app: 'support-assistant' });

tracer.startTrace();
const root = tracer.startSpan('handle-request', { feature: 'ai-summary' });

// Stage 1: retrieval
const retrieval = tracer.startSpan('vector-retrieval');
const context = await getContext(query);
tracer.endSpan(retrieval);

// Stage 2: the LLM call — record model/provider/tokens/cost here
const llm = tracer.startSpan('llm-call');
const answer = await callModel(query, context);
tracer.endSpan(llm, {
  tokens: answer.usage.total_tokens,
  cost: answer.usage.cost,
  model: 'gpt-4',
  provider: 'openai',
  input: query,
  output: answer.text
});

tracer.endSpan(root);
tracer.send(); // flush spans to the Watchlog agent
The Python API mirrors it (start_trace(), start_span(), end_span(..., tokens=, cost=, model=, provider=), send()).
Two things worth calling out from the actual SDK config, because they matter in production:
- It's built to be safe in a hot path. Spans are batched (
batchSize/flushOnSpanCountdefault 50), flushed on a background interval (autoFlushInterval1000ms), retried (maxRetries3), and queued to disk with a TTL if the agent is briefly unreachable — so instrumentation doesn't block or lose your request path. - Sensitive fields are redacted by default.
password,api_key, andtokenare stripped from metadata out of the box (sensitiveFields), which matters because you're recordinginput/output— i.e. real prompts and completions. Extend that list before you log anything user-identifiable.
Spans go to the local Watchlog agent — http://127.0.0.1:3774 by default, or automatically to the in-cluster agent (watchlog-node-agent.monitoring...:3774) when it detects Kubernetes, or wherever you point WATCHLOG_AGENT_URL. No separate SDK key to wire up if the agent is already running.
Reading the result: where did the time actually go?
Once each stage is a span, a slow request stops being a mystery. A trace where the llm-call span is 5.8s and vector-retrieval is 90ms tells you to stop optimizing your database and start looking at model choice, prompt length, or the provider. The reverse — retrieval at 3s, the model at 800ms — is a completely different bug, and one you'd never have found by staring at the LLM. Recording tokens and cost on the same span is a bonus: latency and spend usually move together (longer outputs are both slower and pricier), so the trace that explains your slowest request often explains your biggest bill too.
[VERIFY] — the visualization and alerting layer. How these traces are charted (waterfall view, per-model latency, percentile trends) and whether you can alert on a latency or cost spike is not spelled out in the AI Traces docs. Watchlog's APM product documents avg/p95/max trends and per-stage time breakdowns for application traces, but confirm with the product team whether AI-trace spans get the same dashboards and thresholds before this section promises them. If they don't yet, frame this as "export the spans; build the view" rather than an out-of-the-box dashboard.
Catching it before users notice
Instrumentation only pays off if it runs in production continuously, not just when you're already firefighting. Three habits close the loop:
- Instrument the real path, not a benchmark. Synthetic latency tests miss provider load and real prompt-length variance. The spans that matter come from live traffic.
- Watch the slow tail, not the average. Your p50 can look fine while a slow p95 quietly churns your most active users. Filter traces by duration and read the worst ones.
[VERIFY]percentile filtering on AI spans as above. - Treat a latency regression like an error regression. When a prompt change or model swap adds two seconds, that should be as visible to you as a 500 spike.
[VERIFY]— automated spike alerting on AI-trace latency is not documented; don't imply it exists.
None of this requires a platform migration. If you already run Watchlog for infra, logs, or APM, AI traces land next to the rest of the request in the same agent — which is the practical argument for keeping observability in one place instead of bolting on a separate LLM-only tool.
The bottom line
Slow AI responses are a silent churn machine precisely because nothing alerts on them. The fix is boring and reliable: wrap each stage of the request in a span, record model / provider / tokens / cost on the LLM call, and read the per-stage breakdown instead of guessing. Do that in production and "the AI feels slow" turns into "retrieval is the bottleneck on long queries" — a bug you can actually fix, before a user ever files it as a complaint they'll never actually file.
FAQ (visible on page — required for FAQPage schema)
Why are my LLM responses slow even when the model is fast?
Because total response time is spread across stages you don't control equally — retrieval, prompt assembly, the model call, tool calls, and post-processing. The model is often not the bottleneck. Per-stage span timing is what tells you which stage actually is.
What's the difference between response time and time to first token?
Total response time is the whole request; time to first token (TTFT) is how long until the user sees anything. For streaming UIs, TTFT is what users actually feel. [VERIFY: TTFT is not a documented first-class SDK field — capture it as a manual marker if you claim it.]
Do I need a separate tool just for LLM latency?
Not necessarily. If you already run an observability agent, adding AI-request spans keeps LLM latency next to the rest of your traces rather than in a siloed LLM-only dashboard.
Does tracing add latency to my AI requests?
The Watchlog AI Traces SDK batches spans, flushes on a background interval, and queues to disk with retries, so instrumentation is designed to stay off the critical path. Confirm behavior under your own load before relying on it in a hot path.
Is it safe to record prompts and completions?
The SDK redacts password, api_key, and token from metadata by default. Since you're recording input/output, extend the redaction list before logging anything user-identifiable, and confirm your data-handling requirements.
5. Trust Signals (v2 Section 15)
- Author:
[name + role], linked to author bio. Reviewer:pending — confirm before publishing(SDK/API + pricing claims present). - Last updated:
[date]. Pricing re-verified monthly (page cites a competitor figure). - Sourcing transparency: every SDK claim traces to
docs.watchlog.io/get-started/AI-Traces.html; the one competitor-pricing figure is dated and sourced in §7. - No fabricated proof: no invented customer logos, testimonials, or latency benchmarks. Product proof = the real SDK code sample above; if a dashboard screenshot is added, it must be a real Watchlog view, not a mockup.
- Assumption disclosure: all latency numbers in the body (e.g. "5.8s") are illustrative examples of a trace shape, explicitly not measured Watchlog benchmarks.
6. Internal Linking Plan (v2 Internal Linking Standard)
Target 3–8 internal links per 1,000 words; descriptive, varied anchor text; specific pages, never the homepage as a substitute; every link verified 200 before publishing; add ?ref= on cross-domain links.
| Anchor text | Destination | Status |
|---|---|---|
| Watchlog APM and distributed traces | https://watchlog.io/products/apm |
✅ verified live this session |
| APM product (avg/p95/max trends) | https://watchlog.io/products/apm (vary anchor; do not reuse identical text) |
✅ verified live |
| AI Traces docs | https://docs.watchlog.io/get-started/AI-Traces.html |
✅ verified live |
| GenAI Monitoring (quality/safety, not latency) | https://docs.watchlog.io/get-started/Gen-AI-Monitoring.html |
✅ verified live |
| Compare pricing | https://watchlog.io/pricing?ref=blog-debug-slow-ai |
✅ verified live |
| Sibling article — LLM observability for small teams (pillar/cluster) | [verify slug before publishing] |
⚠️ not confirmed — do not publish unverified |
- Rule 5 (reciprocal): if a sibling AI/observability article links here, add the return link within the same publishing cycle.
- Rule 6 (pillar): once an "AI/LLM Observability" pillar exists, link to it from this article on day one.
- Rule 8 (
/pricing): included via Tier-3 CTA — this piece leans commercial (LLM-observability shoppers).
7. External Sources (v2 External Linking Standard — sourcing only, dated, competitors nofollow)
- Datadog list pricing cited as the "enterprise-contract" contrast — infra ~$15/host/mo, APM ~$31/host/mo, logs ~$0.10/GB indexed + ~$1.27/M ingested events (annual). Source: Last9 Datadog pricing breakdown, dated Jun 23, 2026.
rel="nofollow" target="_blank" rel="noopener". Re-verify monthly.- Note: use this only if the final draft actually makes the cost contrast; the current body keeps it light, so this may drop to a single sentence or out entirely. Don't cite a source the body doesn't use.
- OpenTelemetry / provider docs — if the draft references OTEL or a specific provider's latency guidance, link the primary doc (no nofollow), dated.
[add specific dated URL before publishing].
Density check: ≤2–4 outbound links per 1,000 words outside a Sources list. Current plan is well under.
8. CTA Plan (v2 CTA Standard — three-tier, distinct copy, per-CTA tracking)
| Tier | Placement | CTA | Destination | Event |
|---|---|---|---|---|
| 1 (soft) | After "why AI latency is hard" | In-body link, not a button: Watchlog APM and distributed traces | /products/apm |
internal_link_click |
| 2 (primary) | Right after the SDK method / "how to read the result" | Start tracing your AI calls free (button) | app.watchlog.io/signup?ref=blog-debug-slow-ai |
cta_start_free_click |
| 3 (closing) | End of article | Read the AI Traces docs + Compare pricing | docs AI-Traces page · /pricing?ref=blog-debug-slow-ai |
cta_docs_click, cta_pricing_click |
- No duplicate copy: Tier 2 = "Start tracing your AI calls free"; Tier 3 uses "Read the AI Traces docs" / "Compare pricing." ✔
- Pre-publish QA: click every CTA, confirm a live 200 destination (direct response to the empty-
hrefCTA in the July 2026 audit). No exceptions. - Button copy follows the existing weak-vs-strong copywriting guidance.
9. Technical SEO Checklist (v2 Section 16 — measurable)
Core Web Vitals (all pass pre-publish): [ ] LCP < 2.5s · [ ] INP < 200ms · [ ] CLS < 0.1
Structured data:
- [ ]
Articleschema - [ ]
BreadcrumbList— Home → Blog → AI Observability → this article - [ ]
FAQPage— allowed; the FAQ (§4) is visibly rendered - [ ]
Organization— site-wide, not added per-page - [ ] No
Product/Offerschema on this article — it states no Watchlog price of its own; that markup belongs on/pricing
On-page:
- [ ] One H1 = title · [ ] Logical H2/H3, no skipped levels
- [ ] SEO title <60 (47 ✓) · [ ] Meta description 150–160 (152 ✓)
- [ ] Clean slug
/debug-slow-ai-responses-before-users-notice - [ ] Canonical set · [ ] Indexable (no accidental
noindex) - [ ] Code blocks: syntax-highlighted, horizontally scrollable on mobile (protect CLS/INP)
- [ ] Any image: descriptive alt, compressed <150KB, explicit width/height
- [ ] Mobile-first layout verified (not just "responsive")
- [ ] Every internal + external link returns 200 to the correct destination before publishing
10. CRO Tracking Plan
- Per-CTA events (not one aggregate):
cta_start_free_click,cta_docs_click,cta_pricing_click, plusinternal_link_clickfor Tier-1. - Engagement: scroll depth to the SDK code block and to "Catching it before users notice"; FAQ opens; time on page.
- SEO: rankings for "debug slow AI responses" + secondary terms; organic impressions/clicks; indexed status.
- Conversion: signups started/completed attributed via
?ref=blog-debug-slow-ai.
11. Pre-Publish QA Gate
- [ ] Author bio linked; reviewer assigned (replace
pending) - [ ] Every
[VERIFY]flag resolved with the product team — claim confirmed or cut. Non-negotiable for this piece. - [ ] No SDK claim beyond what
docs.watchlog.io/get-started/AI-Traces.htmldocuments - [ ] Competitor figure dated + primary source +
nofollow; monthly re-verify scheduled (or removed if unused) - [ ] Every link (internal + external) returns 200 to the correct page
- [ ] Every CTA clicked and confirmed functional
- [ ] Reciprocal links added to sibling AI/observability articles
- [ ] CWV pass; schema validated in Rich Results Test