
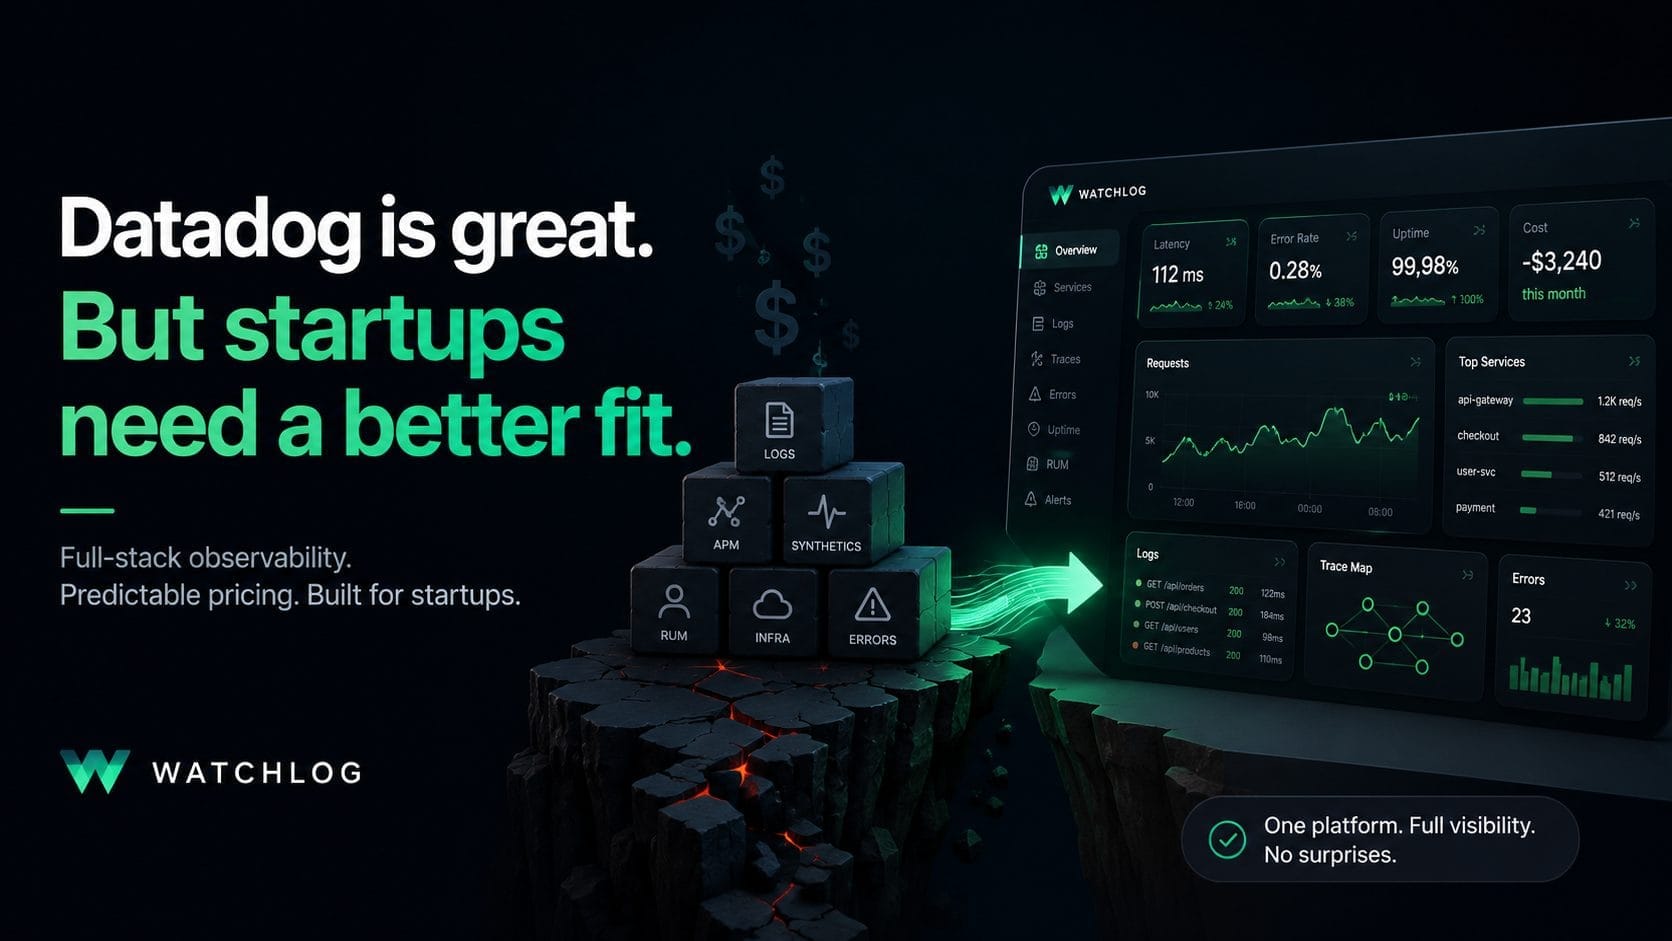
Datadog is a great tool. It's just not always the right tool for a startup.
If you're a startup running a cloud-native stack, there's a good chance you either use Datadog or seriously considered it. And for good reason — it's one of the most capable observability platforms available.
The problem usually isn't capability. It's fit.
Two patterns show up again and again in small engineering teams:
- The bill grows faster than the team. Datadog's model layers per-host pricing on top of separate, usage-metered products (APM, logs, synthetics, RUM, and more). As your infrastructure and log volume grow, the invoice can climb in ways that are hard to predict — often faster than headcount or revenue. (Verify current Datadog pricing structure against public docs before publishing specifics.)
- The platform outgrows the team. Getting real value out of a full enterprise observability suite often assumes dedicated ownership. A five- to fifty-person startup rarely has a spare engineer to tune, curate and govern it.
The result is a tool that's technically excellent but practically heavy — expensive to run, complex to configure, and easy to under-use.
This guide walks through how to evaluate a Datadog alternative as a startup, what to actually monitor, and where a unified platform like Watchlog fits.
Short answer: what should startups look for in a Datadog alternative?
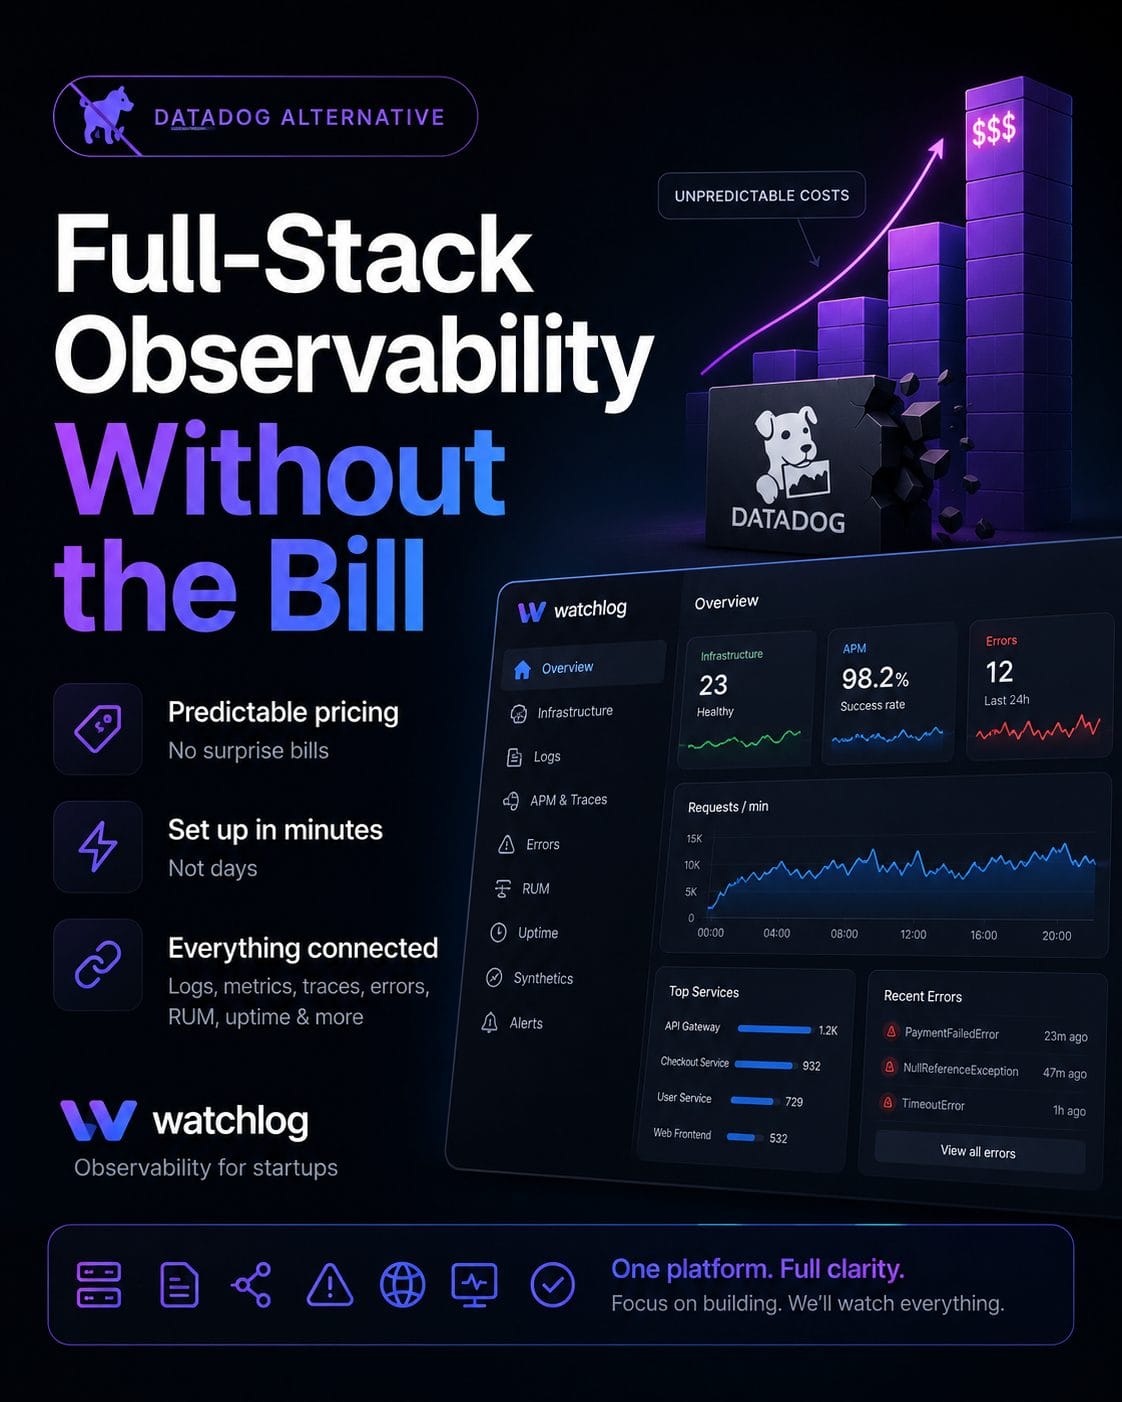
A good Datadog alternative for a startup should give you full-stack coverage in one platform — infrastructure, logs, APM, tracing, errors, uptime and real user monitoring — with:
- Predictable, transparent pricing that doesn't spike with log or host volume
- Fast setup (minutes, not days) without specialist configuration
- Unified context so logs, metrics and traces are correlated automatically
- Low operational overhead — ideally fully managed, so no one on your team babysits the monitoring stack
Watchlog is built specifically around this profile: full-stack observability without enterprise-tool complexity or cost. More on where it fits below.
Why this matters commercially, not just technically
Observability spend is one of the few infrastructure costs that scales with your success rather than shrinking with efficiency. More traffic means more hosts, more logs, more traces — and a bigger bill.
For a startup, that has direct consequences:
- Margin. Unpredictable monitoring costs eat into gross margin exactly when you're trying to prove unit economics.
- Reliability. If cost pressure pushes you to sample aggressively or drop logs, you lose the visibility you were paying for in the first place.
- MTTR. Fragmented tooling — one product for logs, another for uptime, another for errors — slows down incident response because context lives in five tabs.
- Focus. Every hour spent tuning a monitoring platform is an hour not spent shipping.
The goal isn't "cheaper monitoring." It's the right level of visibility at a cost you can forecast, with as little operational drag as possible.
What teams usually get wrong when replacing Datadog
- Comparing on feature checklists instead of fit. Datadog will almost always win a raw feature count. That's the wrong axis for a small team — what matters is coverage you'll actually use, at a price you can plan around.
- Stitching together free tools instead. Prometheus + Grafana + Loki + an uptime tool + an error tracker can look cheap, but you're now the maintainer of five systems and the integrator of all their gaps.
- Optimizing cost by dropping data. Cutting log retention or sampling traces to lower the bill quietly removes the signal you need during an incident.
- Ignoring correlation. Metrics, logs and traces in separate tools mean an engineer has to manually reconstruct context under pressure. That's where MTTR goes to die.
- Underestimating setup and ownership cost. "Free" and "flexible" often means "someone has to run it."
What a startup actually needs to monitor
You don't need every capability an enterprise suite offers. You need reliable coverage across these layers:
- Infrastructure health — CPU, memory, disk, network, processes and host status
- Logs — ingestion, search, filtering and alerting
- Application performance (APM) — traces and slow transactions
- Errors — application error tracking with context
- Real user monitoring (RUM) — real sessions, Web Vitals and frontend errors
- API uptime and latency — are your public endpoints up, fast and returning valid responses?
- Synthetic journeys — scripted checks on critical flows like login, checkout or signup
- Kubernetes and containers — cluster, workload and pod health if you run containerized
- Alerting — routed to where your team already works (Slack, PagerDuty, email, webhooks)
If a platform covers these in one place with automatic correlation, you have startup-grade observability — without the enterprise surface area.
A step-by-step framework for evaluating a Datadog alternative
- Map your real coverage needs. List the layers above and mark what you genuinely need in the next 6–12 months. Ignore capabilities you won't staff.
- Model cost at 3× your current scale. Don't evaluate at today's log volume — project forward. Ask each vendor how the bill behaves as hosts and log volume grow.
- Test setup time honestly. Time how long it takes to get a host reporting live metrics and one useful dashboard. Minutes vs. days is a real signal about ongoing operational load.
- Check for cross-signal correlation. Can you pivot from a metric spike to the related logs and traces without leaving the tool?
- Confirm alert routing fits your workflow. Slack, PagerDuty, email, webhooks — however your team already responds.
- Weigh operational ownership. Fully managed vs. self-hosted changes who's responsible when the monitoring itself breaks.
- Trial with a real incident scenario. Simulate a failure and see how fast you can go from alert to likely root cause.
How Watchlog fits
Watchlog is a unified observability platform built for exactly this situation: teams that want Datadog-style coverage without the complexity or cost profile.
It consolidates the layers a startup needs into a single dashboard:
- Infrastructure monitoring — host and resource health
- Log monitoring — ingestion, search, filtering and alerting
- APM — performance monitoring, distributed tracing and error tracking
- Real User Monitoring — sessions, Web Vitals and frontend errors
- Kubernetes & containers — cluster, workload and pod visibility
- API monitoring — uptime, latency and response validation
- Synthetics — scripted browser tests for critical journeys
- Dashboards & integrations — unified views with auto-detected services
- AI Analysis — AI-assisted incident analysis that explains likely root causes and recommended actions, not just summaries
The workflow it's built around is Collect → Detect → Correlate → Investigate → Alert → Resolve: it collects signals across the stack, detects anomalies, correlates logs, metrics and traces automatically, uses AI to help explain likely root cause, alerts the right channel, and helps you resolve faster.
For a small team, the three things that matter most:
- One platform instead of five, which cuts tool sprawl and keeps incident context in one place.
- Fast setup — installing the agent is designed to take minutes, with hosts reporting live metrics shortly after. (Verify exact setup timing before publishing.)
- Predictable, transparent pricing — positioned against usage-heavy enterprise tools on simplicity and cost predictability. (Verify current pricing and limits on the live pricing page.)
Get started in minutes: create an account, open the Hosts section, copy your API key and server URL, run the install command for your OS, and confirm the host appears online with live metrics. (Confirm current install syntax against docs.watchlog.io before publishing any commands.)
Example scenario
A six-person SaaS team runs a Node.js API and a React frontend on Kubernetes. On Datadog, they were paying for infrastructure, plus APM, plus logs as separate metered products — and log costs jumped every time traffic spiked. Nobody owned the setup, so half the dashboards went stale.
Switching to a unified platform, they get infrastructure, logs, APM, RUM and Kubernetes visibility in one place, with a single predictable line item. When their checkout endpoint slows down, an alert hits Slack, and cross-signal correlation lets an engineer jump straight from the latency spike to the related traces and logs — instead of reconstructing context across three tools.
(Illustrative scenario for explanation, not a named customer case study.)
Comparison and alternatives
There's no single "best" replacement — it depends on your team's shape:
- Stay on Datadog if you have dedicated observability ownership and the budget to match. It remains the most feature-complete option.
- Build a DIY open-source stack (Prometheus, Grafana, Loki, etc.) if you have the engineering time to run and integrate multiple systems and want maximum control.
- Use point tools (a separate uptime tool, a separate error tracker) if you only need narrow coverage — accepting the tool sprawl that comes with it.
- Use a unified platform like Watchlog if you're a small-to-mid team that wants full-stack coverage, fast setup, automatic correlation and predictable cost without a dedicated owner.
Watchlog is a practical option for small teams that want unified observability without enterprise-level complexity or cost. It won't replace a heavily-customized enterprise deployment in every scenario — but for most startups, that level of surface area is exactly the thing they're trying to avoid.
Try it for your stack
- Start Free — spin up an agent and see live metrics from your own host in minutes.
- Compare Pricing — model your cost against your current observability bill.
- Book a Demo — walk through a real incident workflow with the team.
Internal links
- Reduce Datadog Bill
- Affordable Observability Platform
- OpenTelemetry Observability
- Startup Observability Stack
- Pricing
FAQ
Is there a genuinely free tier?
Watchlog offers a free plan with no credit card required, suitable for getting started and evaluating coverage. (Verify current free-tier limits before publishing.)
Will a Datadog alternative give me less visibility?
Not necessarily. For a startup, the risk with any large platform is under-using it. A unified platform that covers infrastructure, logs, APM, RUM, uptime and synthetics in one place often delivers more usable visibility because the context is correlated rather than scattered.
How long does setup take?
Watchlog's agent is designed for fast setup — typically measured in minutes to get a host reporting live metrics. (Verify exact timing and OS support against docs before publishing.)
Which environments does the agent support?
Supported deployment environments include Ubuntu, Windows, Docker, Kubernetes and source install for Linux. (Confirm the current list on docs.watchlog.io.)
Can I keep my existing alerting workflow?
Yes — alerts can route to channels including Slack, PagerDuty, Telegram, email and webhooks. (Verify current channel support.)
Does Watchlog replace Datadog completely?
For most startups running cloud-native stacks, it covers the layers they actually use. For heavily-customized enterprise deployments, evaluate against your specific requirements rather than assuming a one-to-one replacement.